Overview - SiteWorx Sense Alarms
 Updated
by
Steve Corbesero
Updated
by
Steve Corbesero
SiteWorx Sense Alarms enables users to configure alarms based on SiteWorx Sense Device data and trigger incident notifications via Email or SMS, allowing them to understand when their SiteWorx Sense Device data deviates from the established baseline or norm.
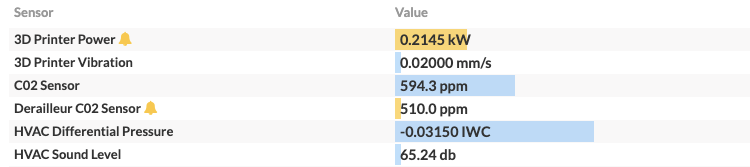
Active Sensors
The Sense Dashboard provides visual indicators of any Active Alarms:
- A yellow banner at the top of the page
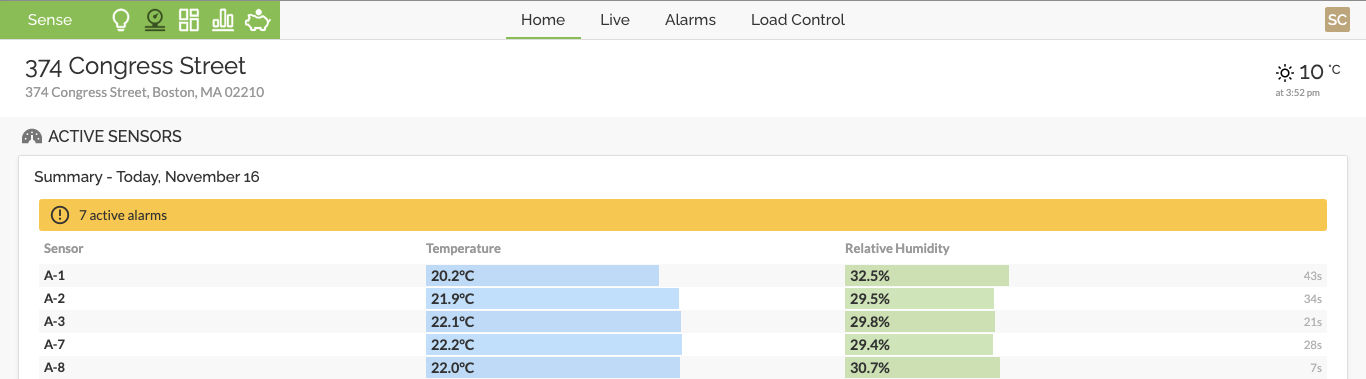
- An Alarm icon next to the sensor name and highlighted sensor data
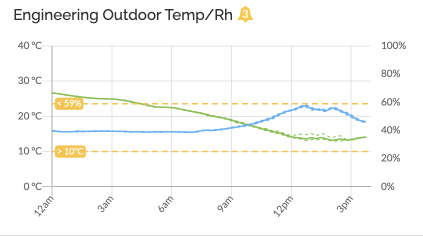
Mini Charts
The SiteWorx Sense dashboard’s mini charts also have an updated look. If a sensor has an active alarm, an icon will appear on an associated sensors Mini Chart next to its name. A dotted yellow line will also be present on the chart indicating the alarm’s activation threshold.
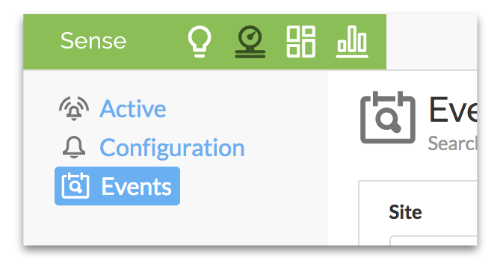
Alarms Management Page
Next to the Sense Live view App Feature navigation menu, the Alarms brings users to the Alarms Management page. Here users can view details concerning active and previously active alarms and create new or edit existing alarms and subscriptions.
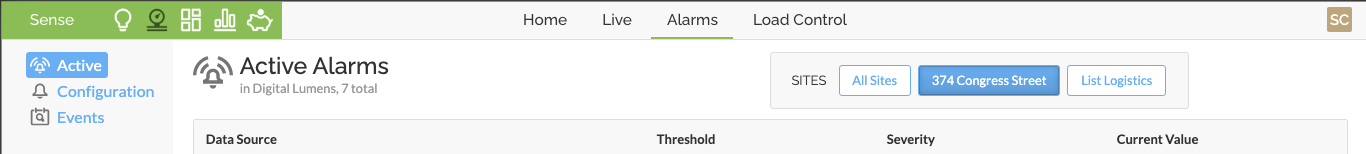
Active Alarms
The Active Alarms page provides a summary of currently active alarms.
The top of this page shows a table view of the currently active alarms. By clicking on any alarm, an associated incident chart appears below.
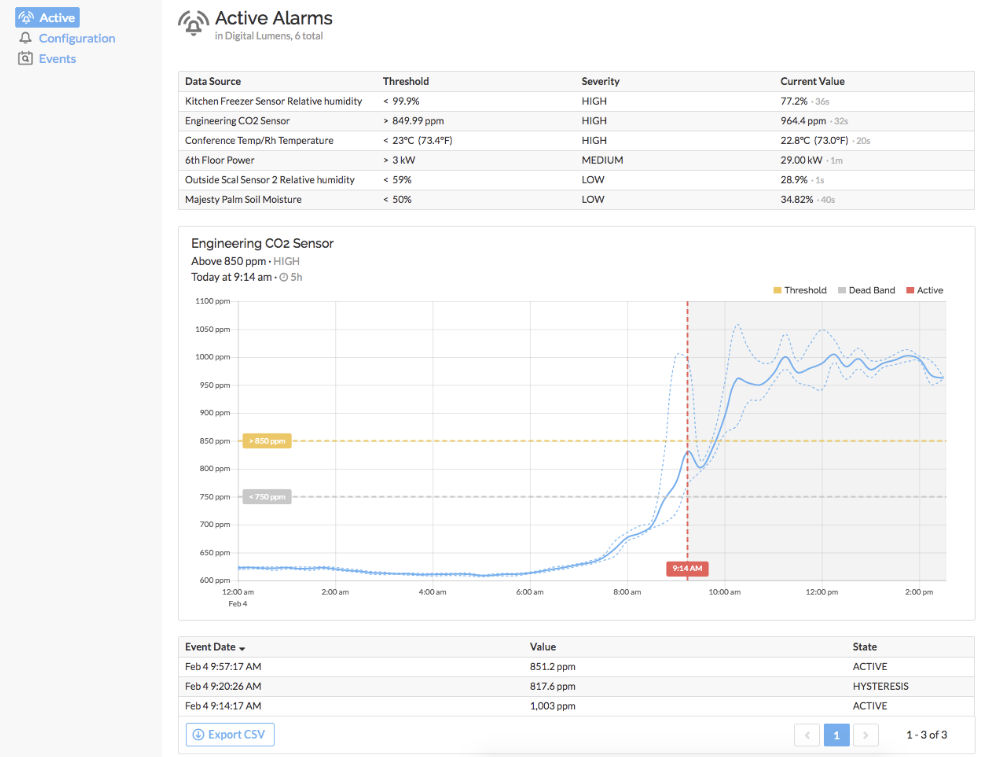
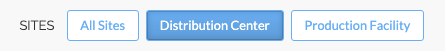
A site selection filter appears at the top of the page for organizations with more than one site.
Alarm Configuration
The Configuration tab provides a snapshot view of all enabled and disabled alarms across the entire SiteWorx Organization, filterable by Site.
From here, an Admin User can create, edit, and delete alarms. Admin Users can also easily enable and disable alarms from this view with toggle buttons.
Creating a new alarm is very simple, please visit How To - Configure an Alarm in SiteWorx Sense for a complete overview.
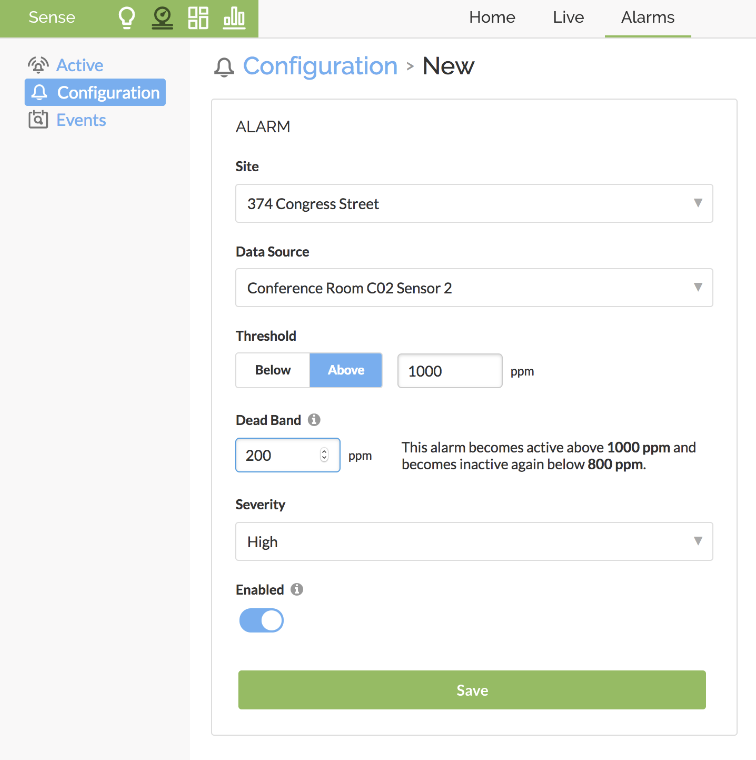
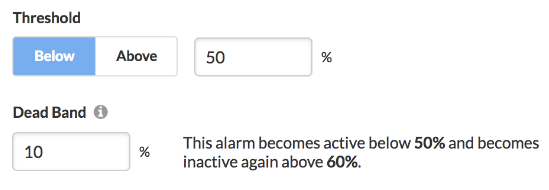
The user can select a threshold value and an optional Dead Band (or hysteresis gap). Help text appears when hovering over the “i” icon next to Dead Band to explain how the value is used. After entering a value for the Dead Band, a description of the programmed behavior will appear.
Alarm Configuration for Cumulative Sensor Data
Alarms for cumulative sensor data require a user to enter an interval for the threshold.
The threshold and interval chosen by the user will depend on how urgent the alarm is, and how granular the user needs the data to be to detect an anomaly.
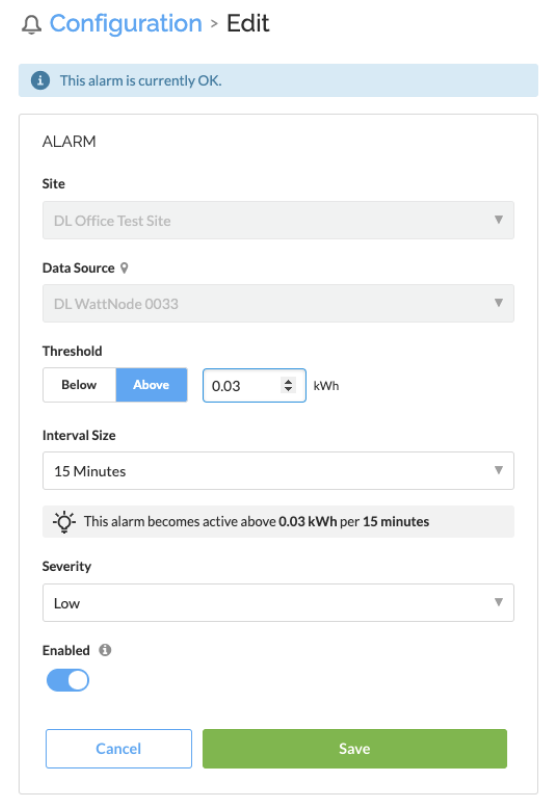
Example: Send me a text when 'Power Meter 0033' uses over 0.03 kWh in 15 minutes.
- Every 15m, SiteWorx will check at the end of that interval whether or not the power meter has used over 0.03 kWh of energy. If it has, at the end of that interval, the user will get a notification.
- At the beginning of each interval, the alarm will “reset” and check the threshold at the end of that subsequent interval.
Dead Band
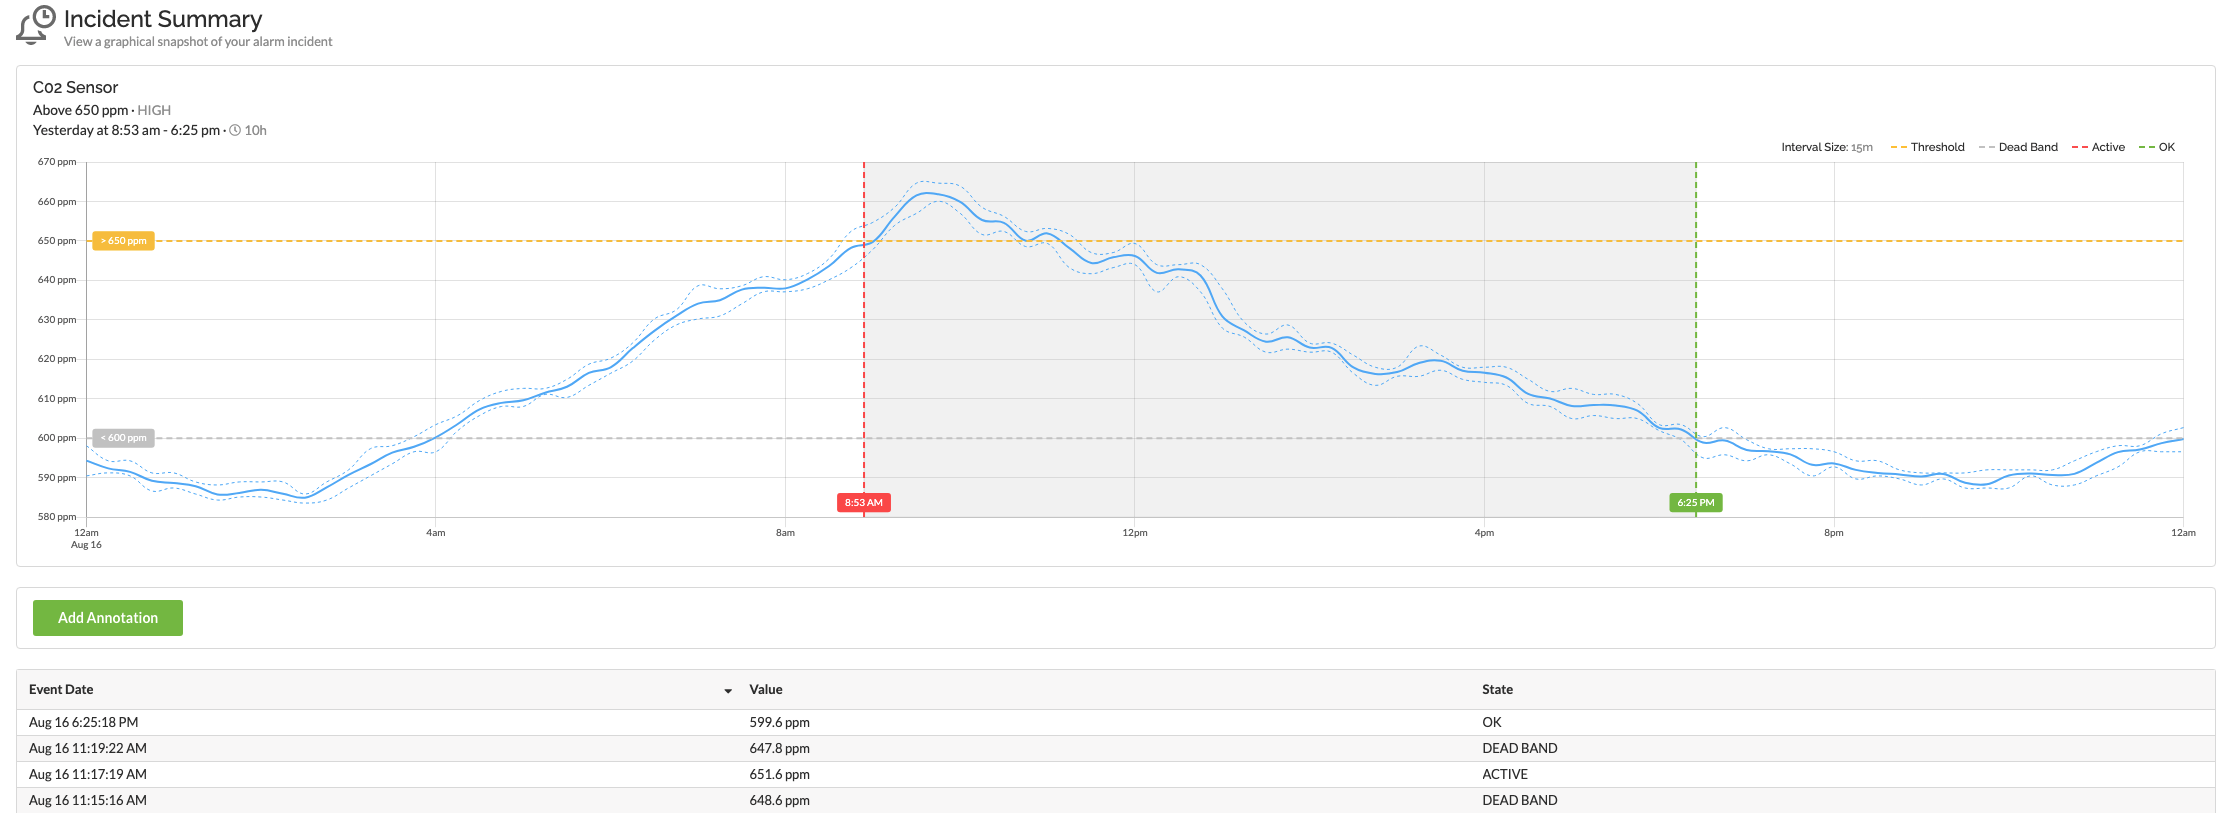
Here's an excellent example of why a dead band (hysteresis gap) can be useful. This particular alarm will not clear until the sensor value (blue) falls below the dotted gray line. In this example, without the dead band, the alarm would become active and OK several times, causing potentially unnecessary notifications.
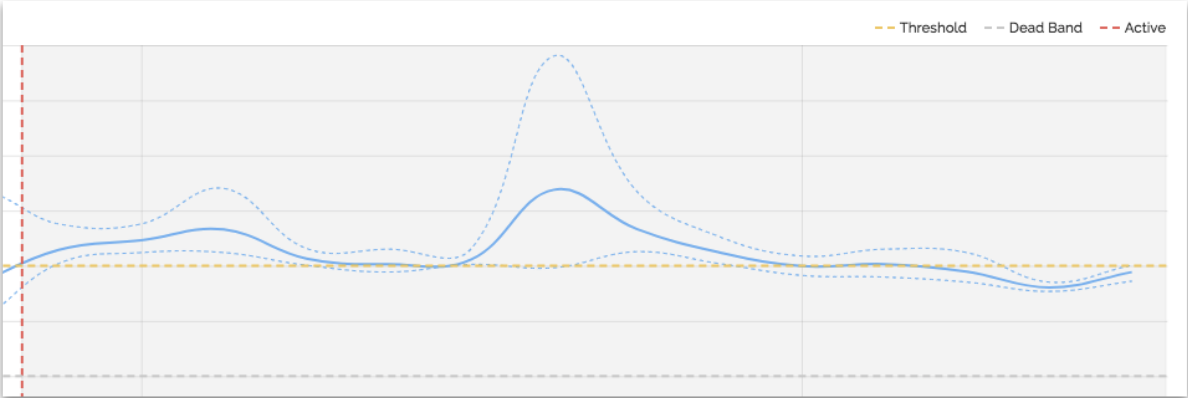
It is important to note that this example shows a dead band that is quite a bit lower than the alarm's activation criteria. All alarms and dead bands will take a little bit of baselining and "tuning" to know what works. Fine-tuning depends on the data trend, the frequency of potential alarm events, and the alarm's severity.
Alarm Subscription
Alarm subscriptions appear below the alarm configuration details.
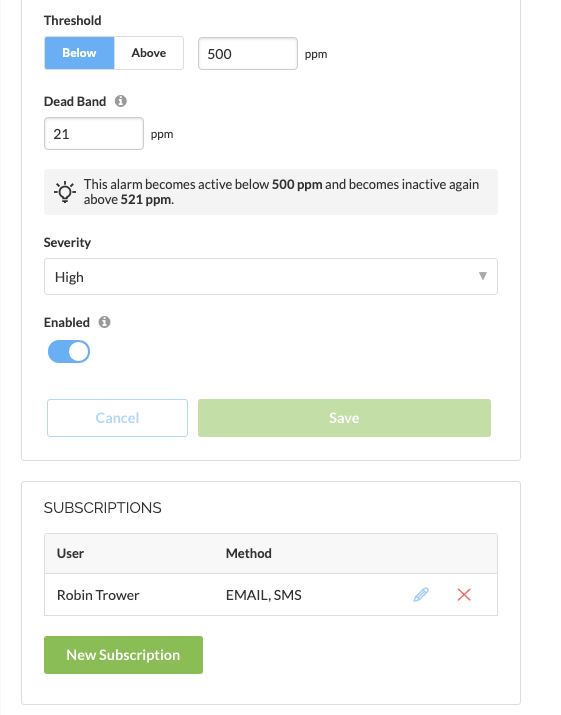
Users can create subscriptions for any SiteWorx user regardless of permission level. To learn more, visit How To - Configure an Alarm Subscription
All users can edit their account info to add a valid mobile phone number to enable SMS notifications. To learn more, visit How To - Add and Verify your phone number for SMS Alerts
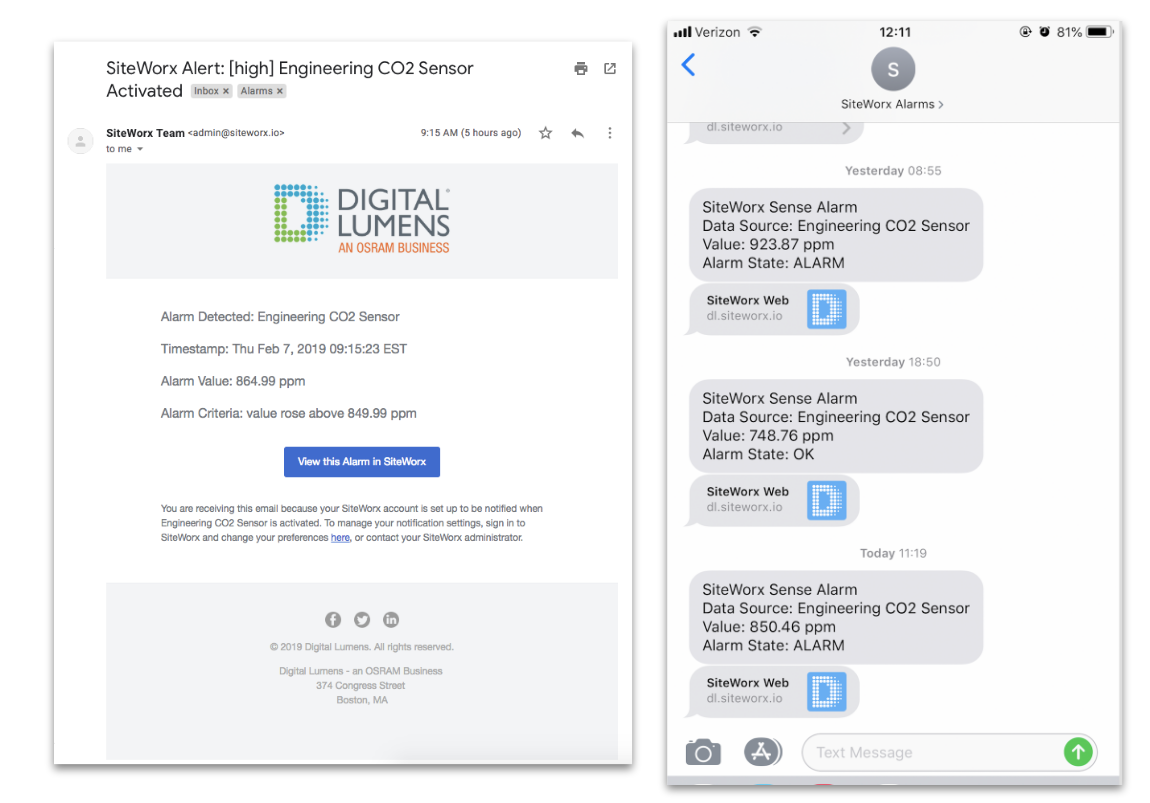
Notifications
Here are examples of both email and alarm notifications:
Events & Incidents
The last tab in Alarms is for Events, which contains a database of the alarm activity for a site. Several dropdowns act as filters to make it easier to find a particular event or incident (a series of events from alarm activation to alarm clearing).
The last column of the events table indicates the event’s associated Incident ID:
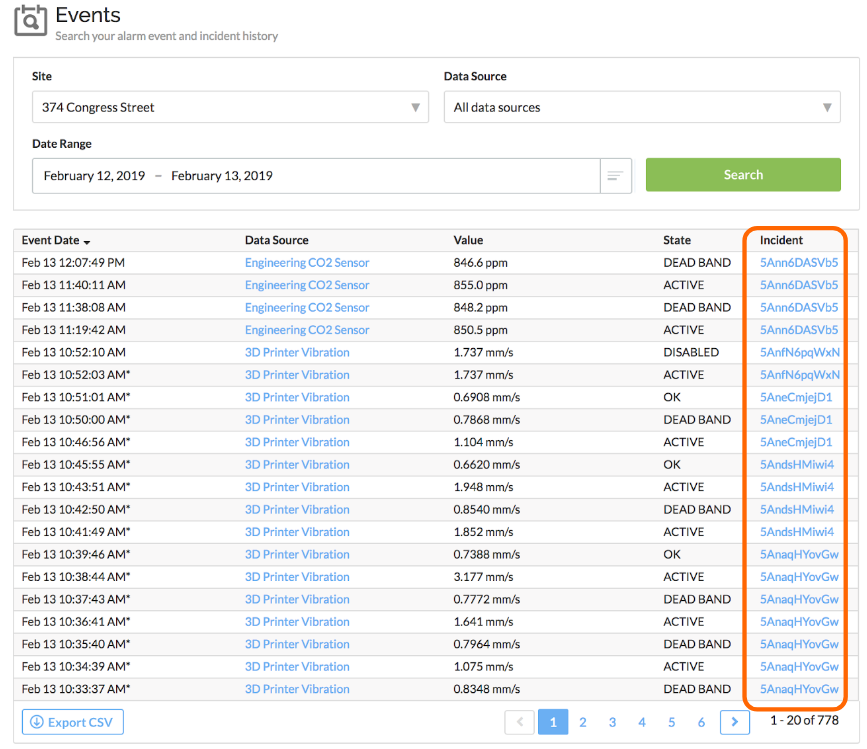
Clicking on the Incident ID will bring a user to the associated Incident Summary, which includes details of the incident, a chart, and the events in a table.
Incident Summary & Charts
The Incident Summary includes details of the incident, chart, annotation, and a table of that particular incident’s events.
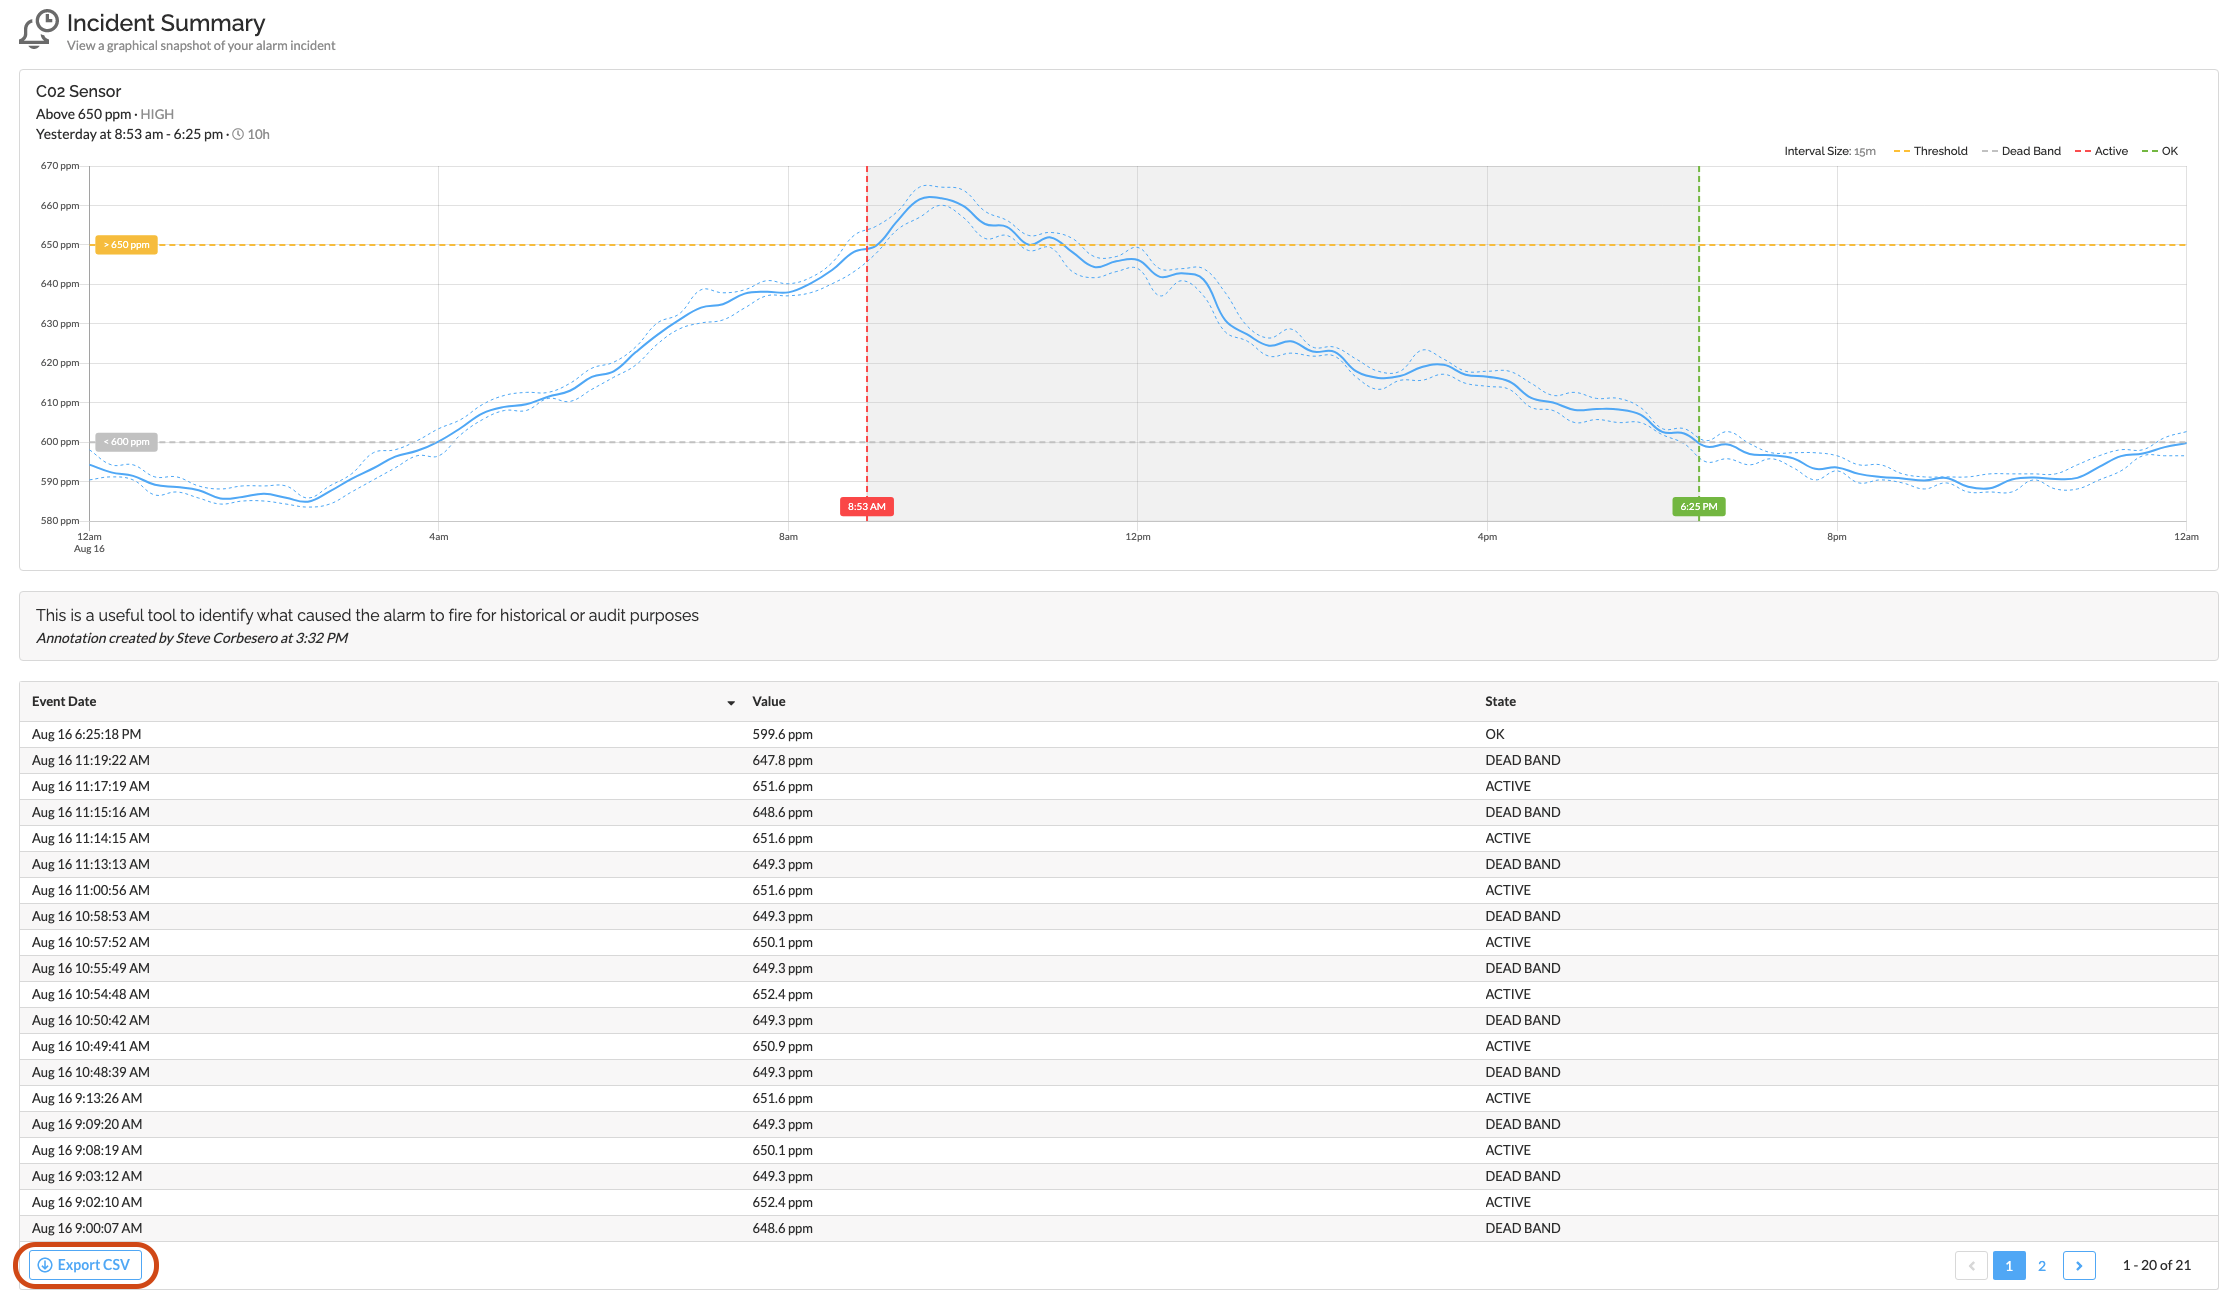
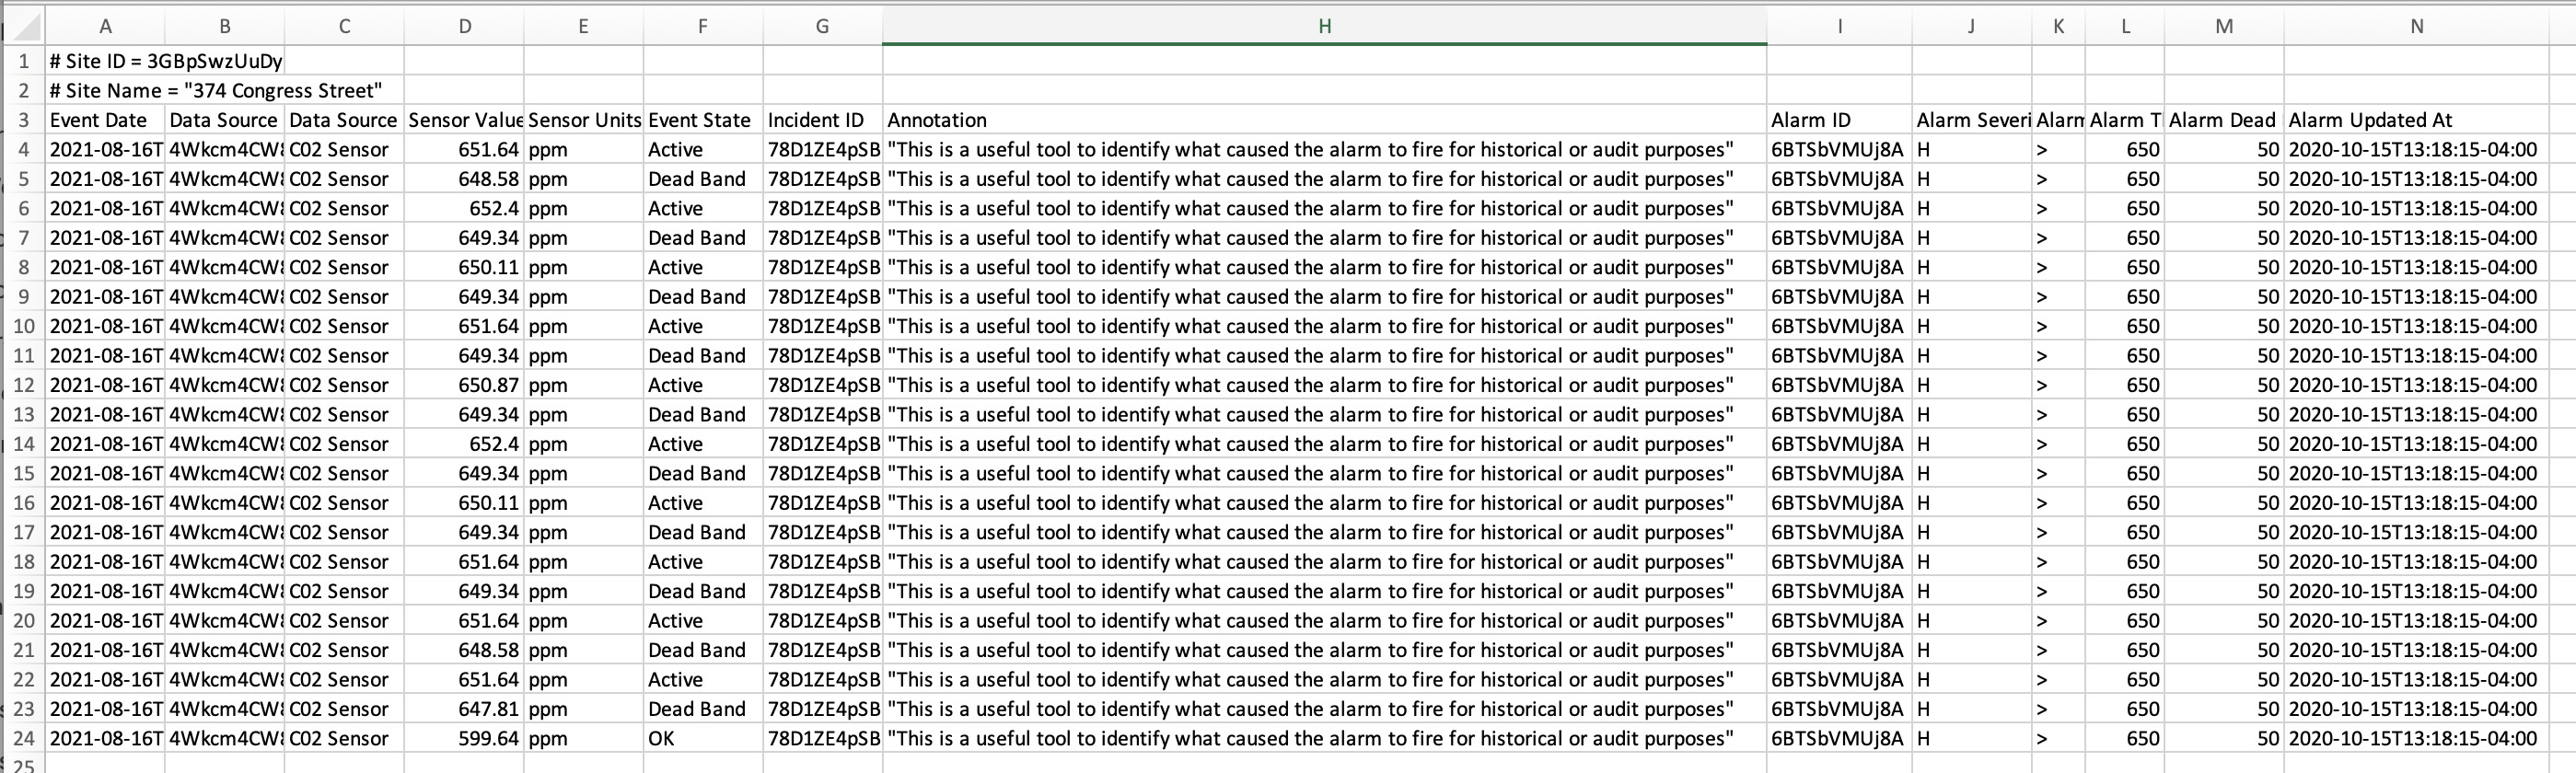
From both the main Event table and the incident summary table, a user can export the event details to CSV, which has further information than the event table.
Alarm Annotations
Alarm Annotations are auditable notes that a user can add to any Alarm Incident. Adding an annotation is helpful to identify the root cause of the issue or environmental state that instigated the alarm and inform your team of such occurrence.
Each annotation is tagged with the user's identity and the timestamp when the user created or updated the annotation.

To add an annotation to an incident, a user can use the Active Alarms tab for current, active alarms OR search through previous alarm incidents using the Alarm Events section. To update or delete an existing annotation, simply click into the text field and enter new text or click the trash can icon on the right hand side.

Editing Alarms
Take note that users are allowed to edit existing alarms, even if they are currently active. For example, if an alarm is active, but a user wants to update the alarm’s threshold value or disable the alarm, they can do so.
Because all event history is, in fact, a history that cannot be changed, incidents before alarm edits remain in the event table, but with an asterisk (*) next to the event date in the table. This asterisk indicates that the alarm details have been modified since the incident occurred.
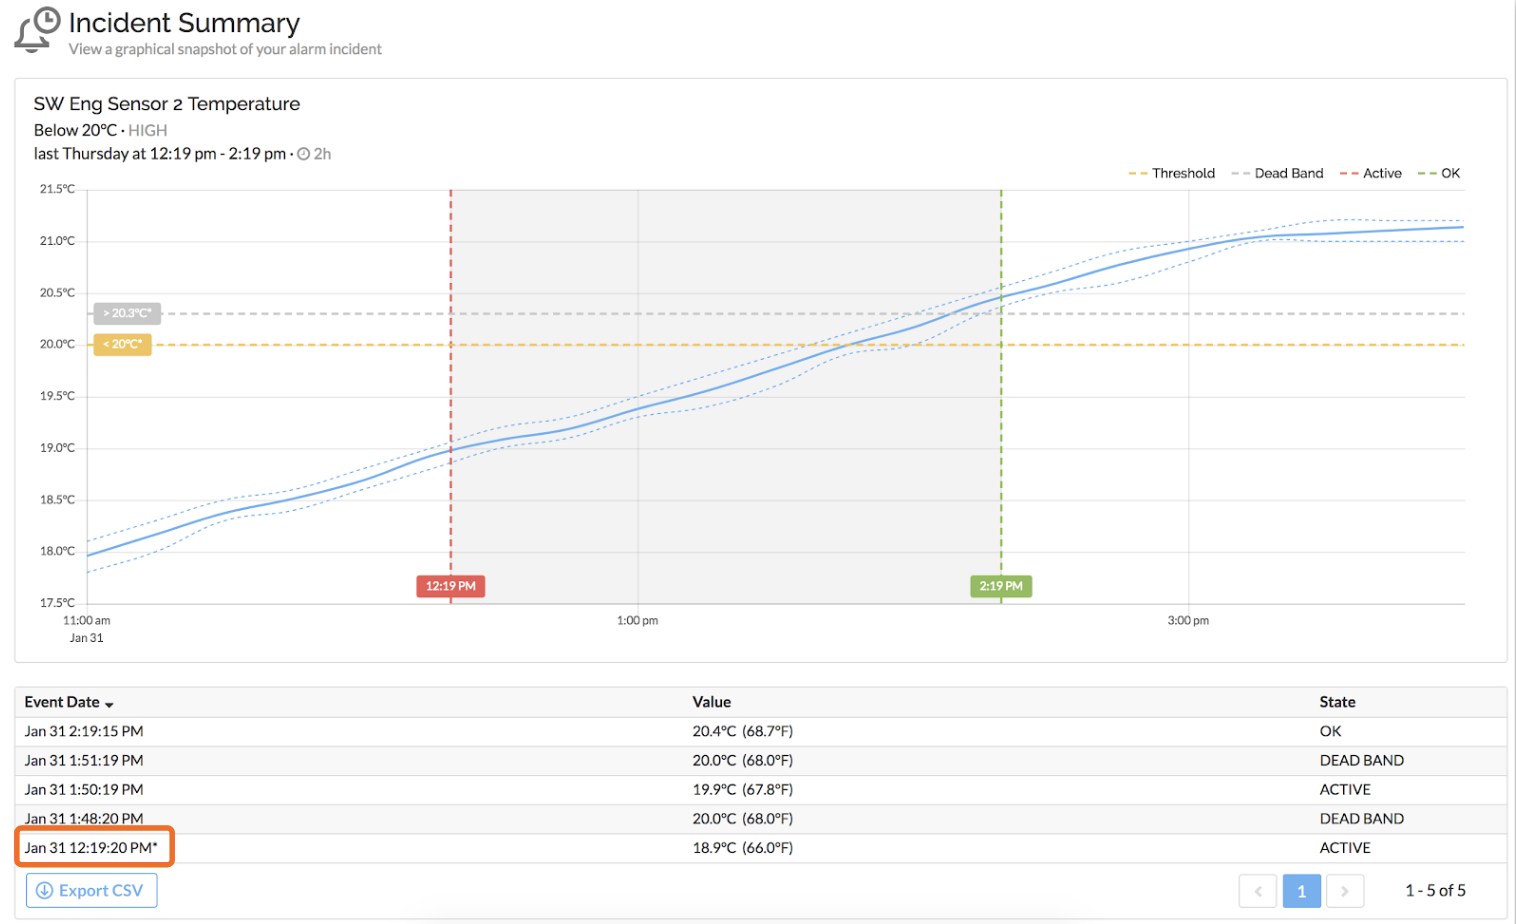
The example above shows an asterisk on the last event in the incident’s table, indicating that a user-edited the alarm after that point in time. All other events related to this incident reflect the alarm’s current parameters. By looking at the chart, it is clear that the activation criteria changed after the alarm went active at 12:19:20 PM (because the range of the sensor data does not overlap with the activation time and the current alarm threshold of 20.0°C).
Notes & Best Practices
- Note that typically, people will use alarms to notify of something hazardous, dangerous, or out-of-the-norm. SiteWorx is only notifying the user of an alarm once. It is up to the user to manage the actual sensor response and is not intended to be used as a replacement for an emergency notification system. Think of it as a warning for a potential emergency instead.
- SiteWorx Sense Alarms work best for sensor data that exhibits gradual trends that may indicate a problem.
- SiteWorx Sense Alarms can also be used for data that rapidly changes, but be wary that SiteWorx collects data from sensors just once per minute (at the fastest), so depending on when the activation event and the sampling rate sync up with each other, a user may not be notified of the alarm until up to a minute after it happens in real life.
- For the same reason as above, if sensor data “spikes” or acts abnormally within the 1-minute window of data collection, SiteWorx may miss that spike entirely.
- SiteWorx Sense Alarms can currently only be used on sensor data (not occupancy or lighting events).
- It is important not to have too many alarms enabled. Otherwise, they can easily get ignored!