How To - Run a Historical Sense Report
 Updated
by
Steve Corbesero
Updated
by
Steve Corbesero
Like SiteWorx Tune, historical reporting is available for all connected SiteWorx Sense Devices. To run a historical report for a particular Sense Device datasource like temperature, relative humidity, or energy usage from a power meter, follow the steps below:
- Click the Analyze Icon on the Application Navigation menu
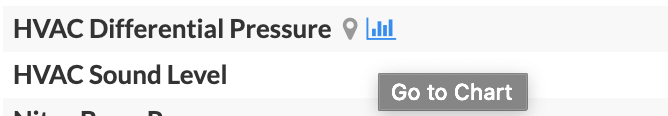
- Alternatively, hover over a particular datasource in the Active Sensors or Power Meters cards on the Sense Dashboard to expose a quick link
- Select the Site
- Select the datasource type from the Display dropdown
Datasource types depend on the type of Sense Device deployed at your facility
- Select the Interval Size
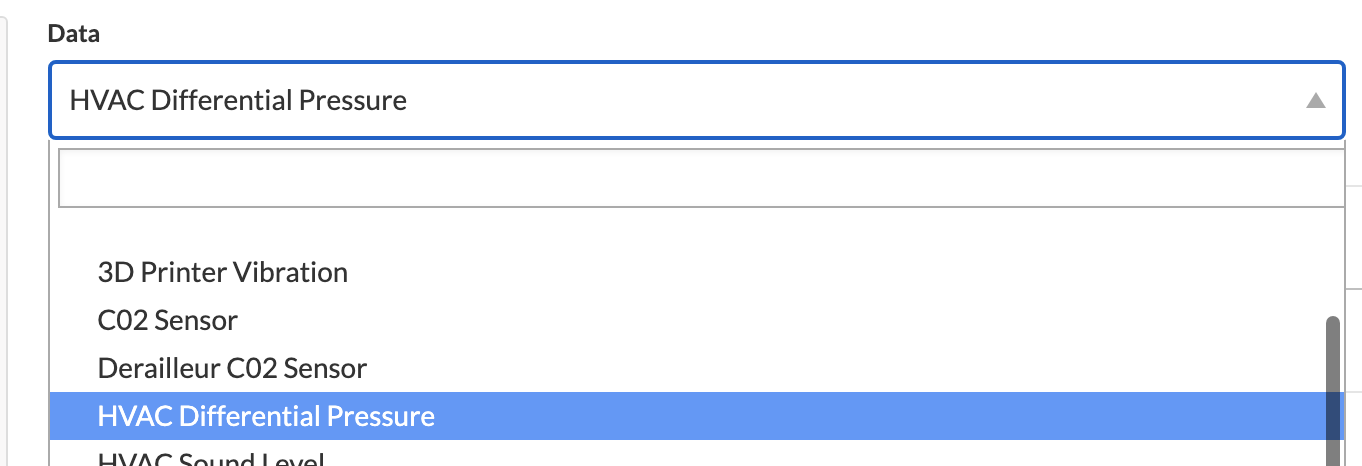
- Select the desired Sensor datasource from the Data dropdown
- Select the desired Date Range via the options below:
- Access the dropdown for a preset range
- Enter specific dates in manually
- Drag the navigator below the chart
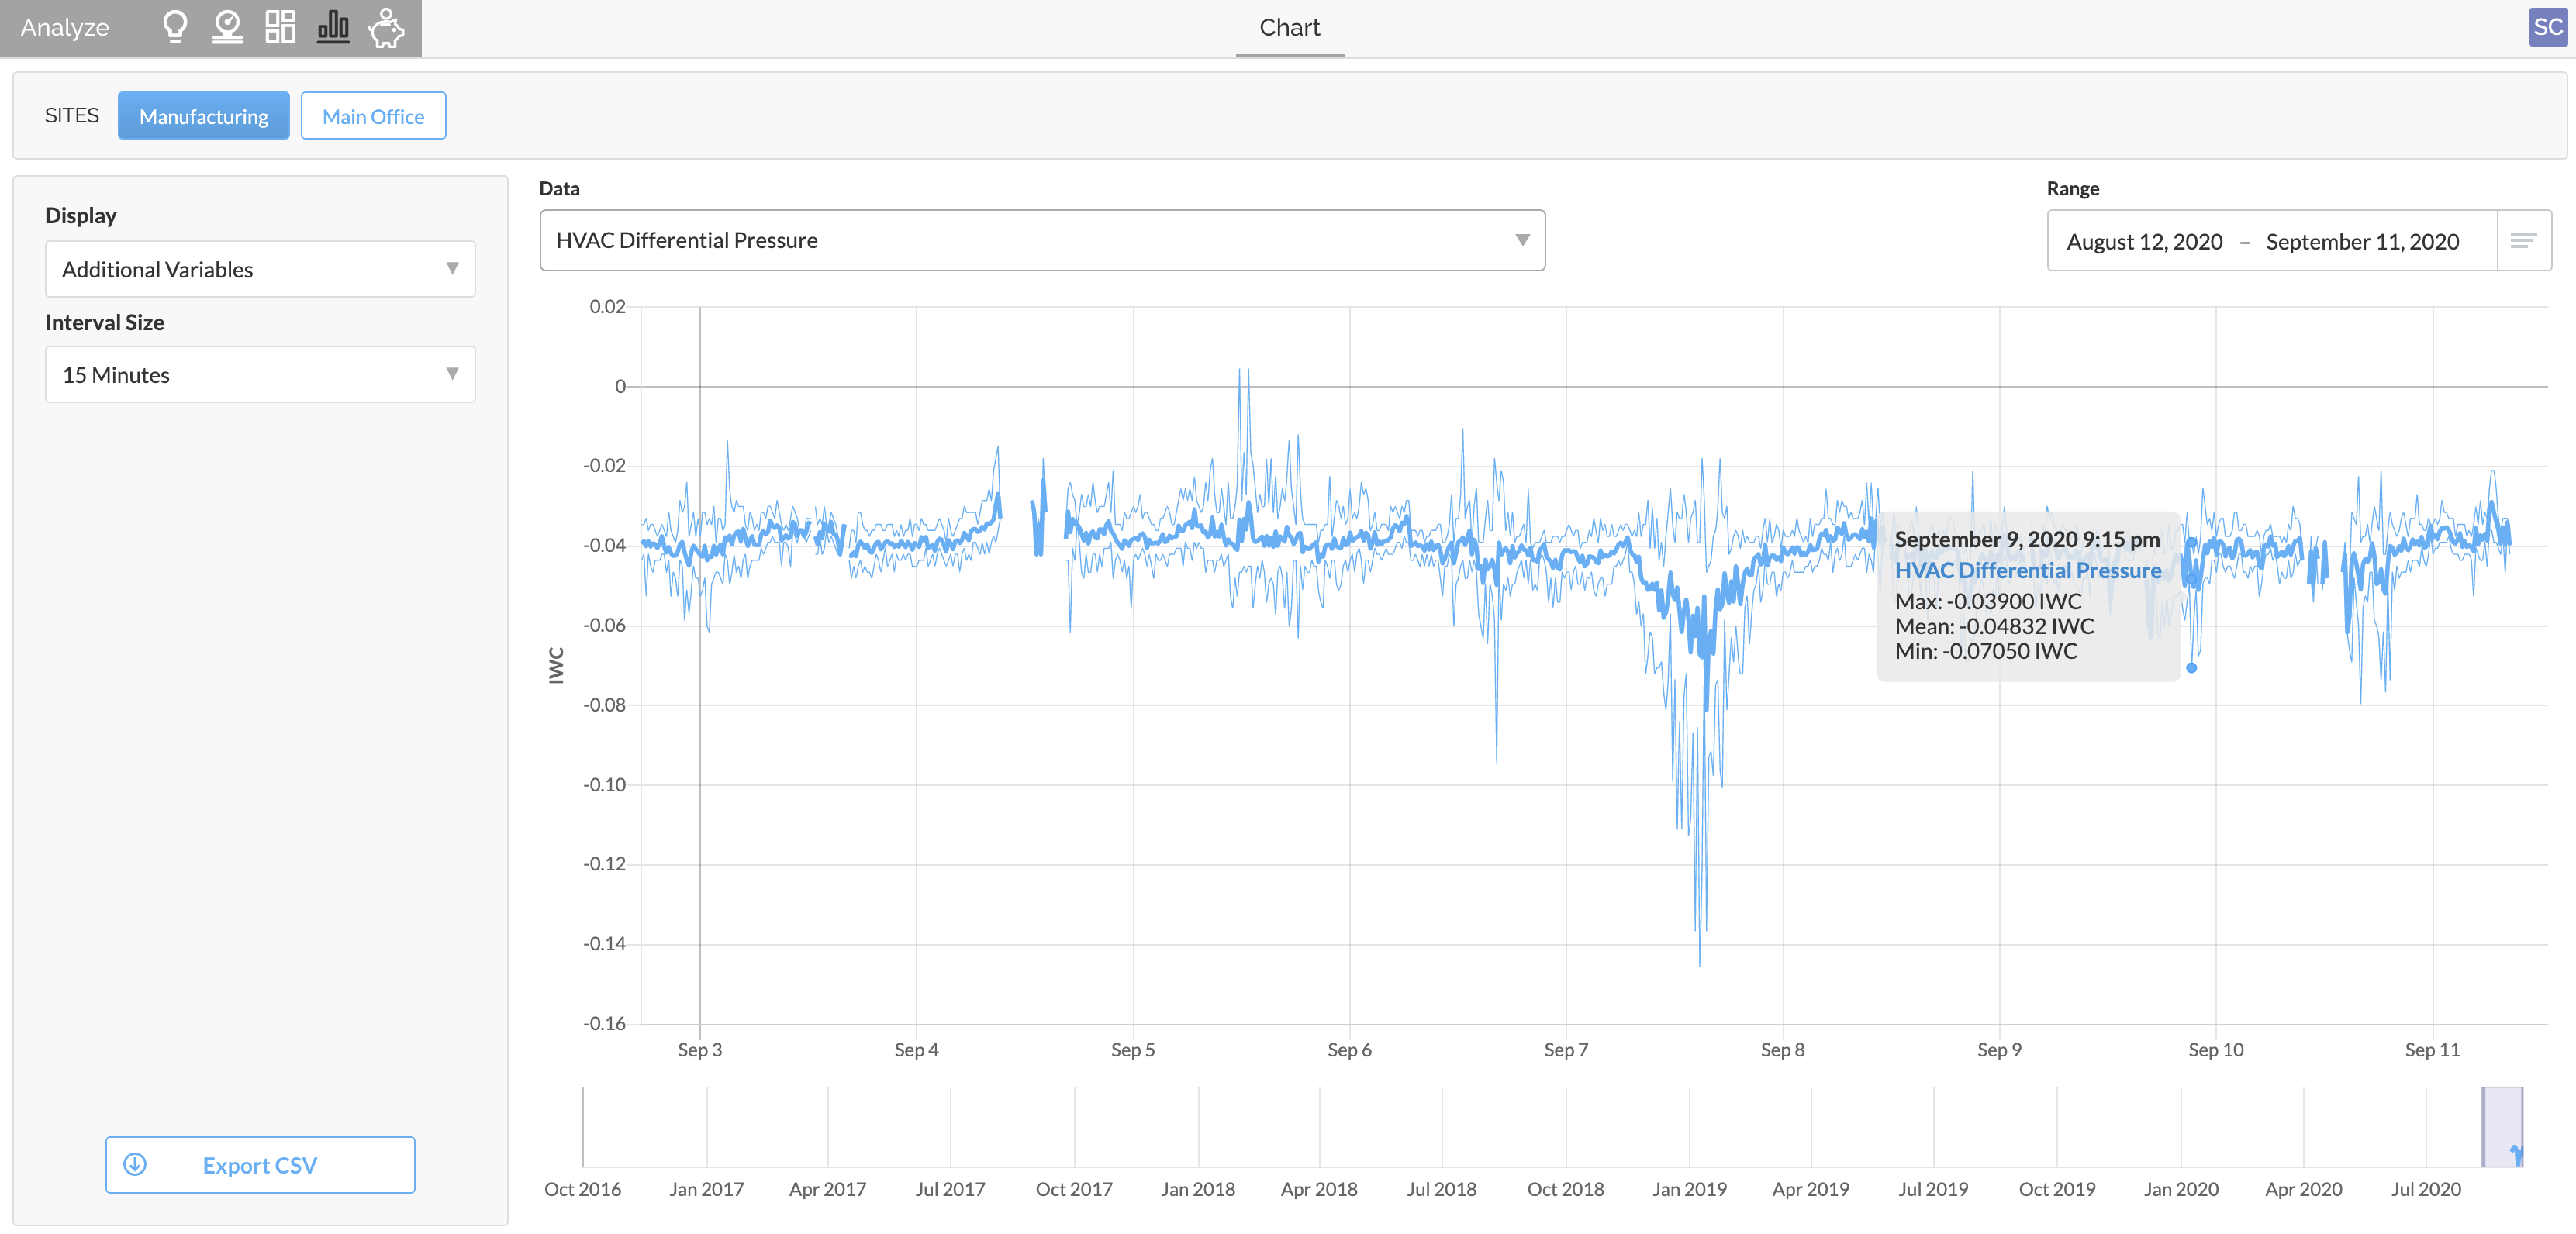
To export data, click the Export CSV button