SiteWorx Insights #6 — Live View
 Updated
by
Siteworx Marketing
Updated
by
Siteworx Marketing
SiteWorx Sense Live View — for critical, at a glance facility data
Monitoring an entire facility can be overwhelming in the best of times. SiteWorx Sense Live View provides a simple, organized view of all critical sensor information in an easy-to-interpret visual map. You can quickly check current operating conditions, energy consumption levels, power quality characteristics, and flow rates in real time without refreshing pages or changing between screens.
Active SiteWorx data sources of all types are combined and color-coded within Live View. Sensor locations will "pulse" to indicate when sensor data is received and refreshed.
Live View is fully interactive, with built-in Tooltip features for all sensor types, allowing a user to mouse over every sensor location on the map to see specific information at a glance.
In addition, Temperature and Humidity sensor data is plotted and presented on a live bee swarm chart that shows sensor points that are out of range or have active alarms.
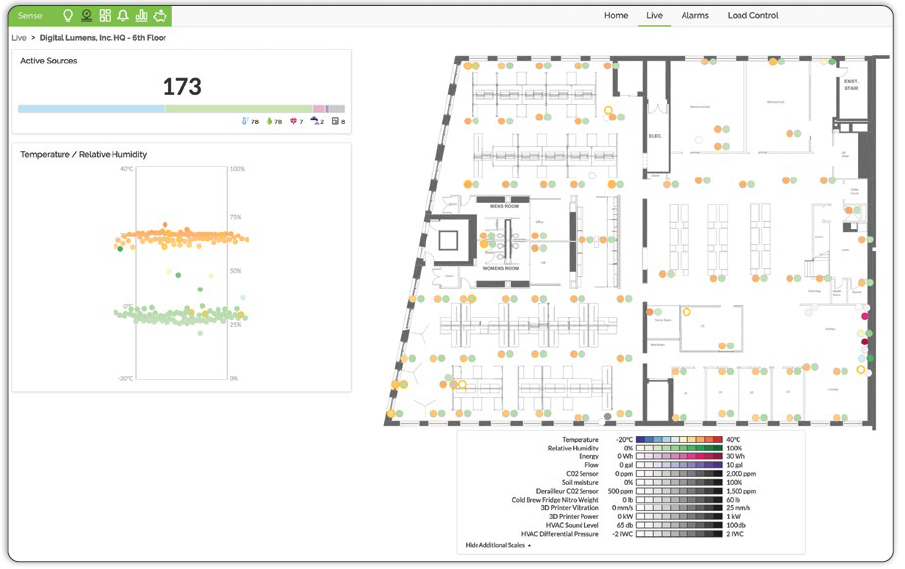
The sensor status is color coded and represented in its actual physical location, helping to quickly identify areas that need attention.
With Live View, the latest sensor data is clearly displayed, along with a simple trend arrow indicating if the value rises or falls over time. Sensor alarms and the alarm criteria are also visible when active. Active alarms can be viewed by mousing over a data source to reveal the Tooltip.
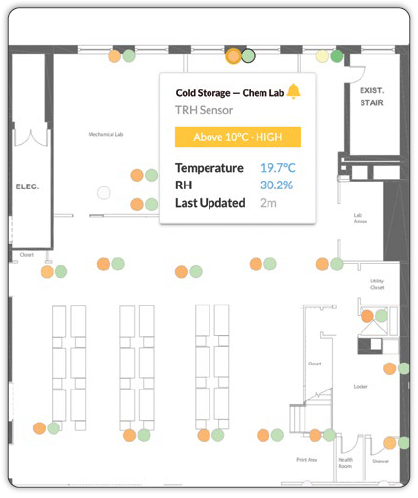
Tooltips, which are revealed when a user mouses over any data source, show current sensor data and all active alarms.
Live View is available to all SiteWorx Sense users, keeping you informed and aware of conditions within your facility, one data point at a time.
SiteWorx Insights brings real-world functions and capabilities available to all subscribers of the SiteWorx Application Suite.