Overview - SiteWorx Area Heatmaps
 Updated
by
Steve Corbesero
Updated
by
Steve Corbesero
SiteWorx Area Heatmaps provide complete sensor coverage of your building, enabling detailed occupancy and path tracking. Customizable reports deliver the insight you need to make data-driven decisions regarding optimized floor plans, inventory placement, and more.
Heatmaps
The Heatmap report displays data as an overlay on the facility floor image, visualizing historical occupancy across the facility. Like other reports, the Heatmaps are fully customizable.
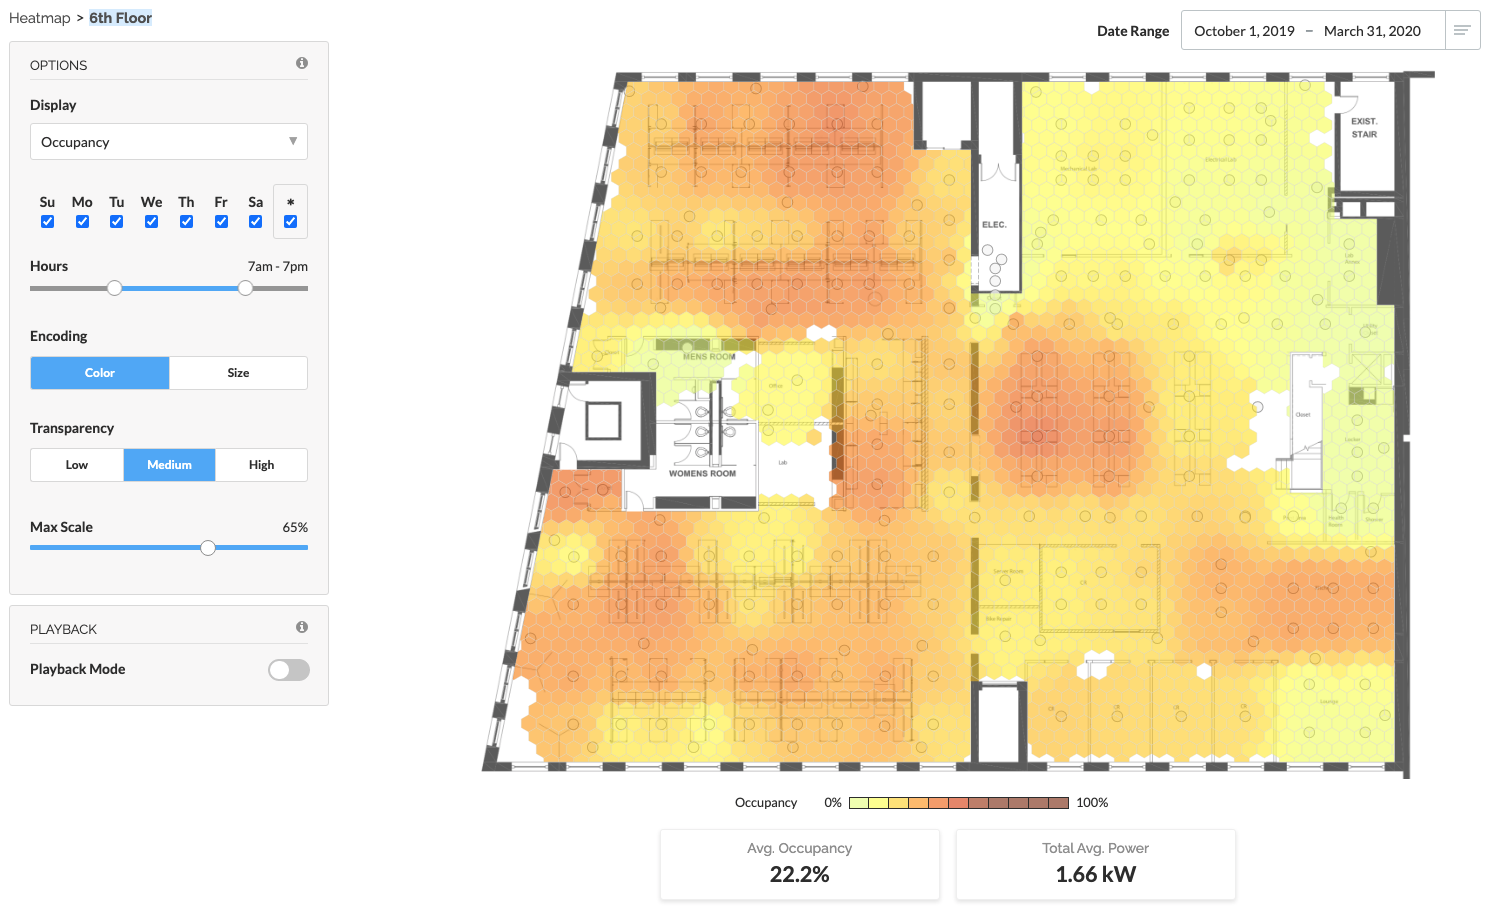
Users can adjust the date or time range, and the Heatmap tiles are configurable to visualize variations. Users can also use the Playback Mode to view how occupancy shifts over 24 hours.
Playback Mode
Playback Mode is another powerful tool to visualize occupancy patterns throughout the day. By selecting the date range, days, and hours you would like to explore, SiteWorx creates a transitional animation of the occupancy patterns.
For example, to visualize the daily shift in occupancy patterns over a full 24 hours during the week, select the entire range on the Hours slider and applicable weekdays.
Interpreting the Heatmap
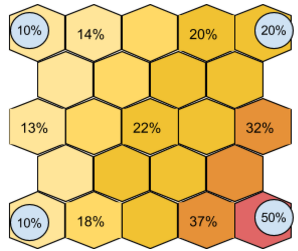
The Heatmap is a visual representation of data across space. That space is divided into hexagonal tiles whose values are not linked to a specific fixture. Instead, they are the result of a calculation of the values of nearby fixtures, adjusted by distance.
The value for a given tile is most heavily influenced by fixtures near the tile’s center, while less influenced by fixtures farther away. The number shown when hovering over a tile is the calculated value at the tile’s center.
The following image shows how closer lights have more influence: