Navigating the SiteWorx Tune Dashboard
 Updated
by
Steve Corbesero
Updated
by
Steve Corbesero
The SiteWorx Tune Dashboard showcases pertinent energy usage data across all connected sites under the organization, labeled under different segments. Each Site segment contains a collection of data cards representing different energy usage metrics, or charts for that specific Site. Each data card updates every 60 seconds with the most up-to-date information.
The following data cards are available for display on the dashboard:
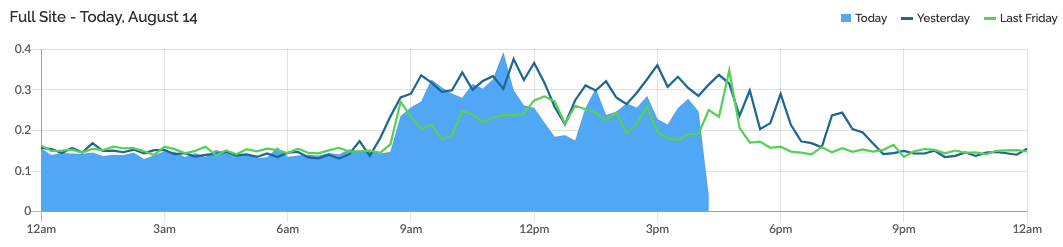
Full Site Energy Usage Comparison Chart
Compares the current days' energy usage across the full Site against the energy usage of one day, and seven days prior.
Total Savings Widget
Displays the total amount of savings since SiteWorx was deployed. By clicking the dollar amount links to the SiteWorx Savings report SiteWorx Analyze.

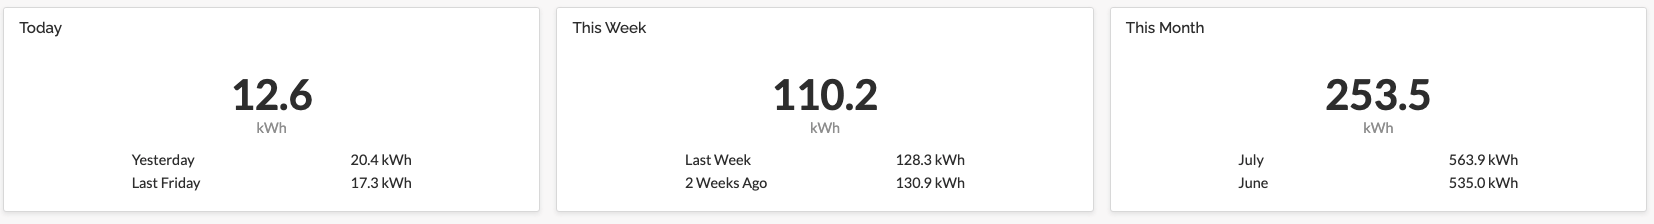
Energy Usage Snapshots
Displays the full Site's aggregated energy usage for the day, week, and month.
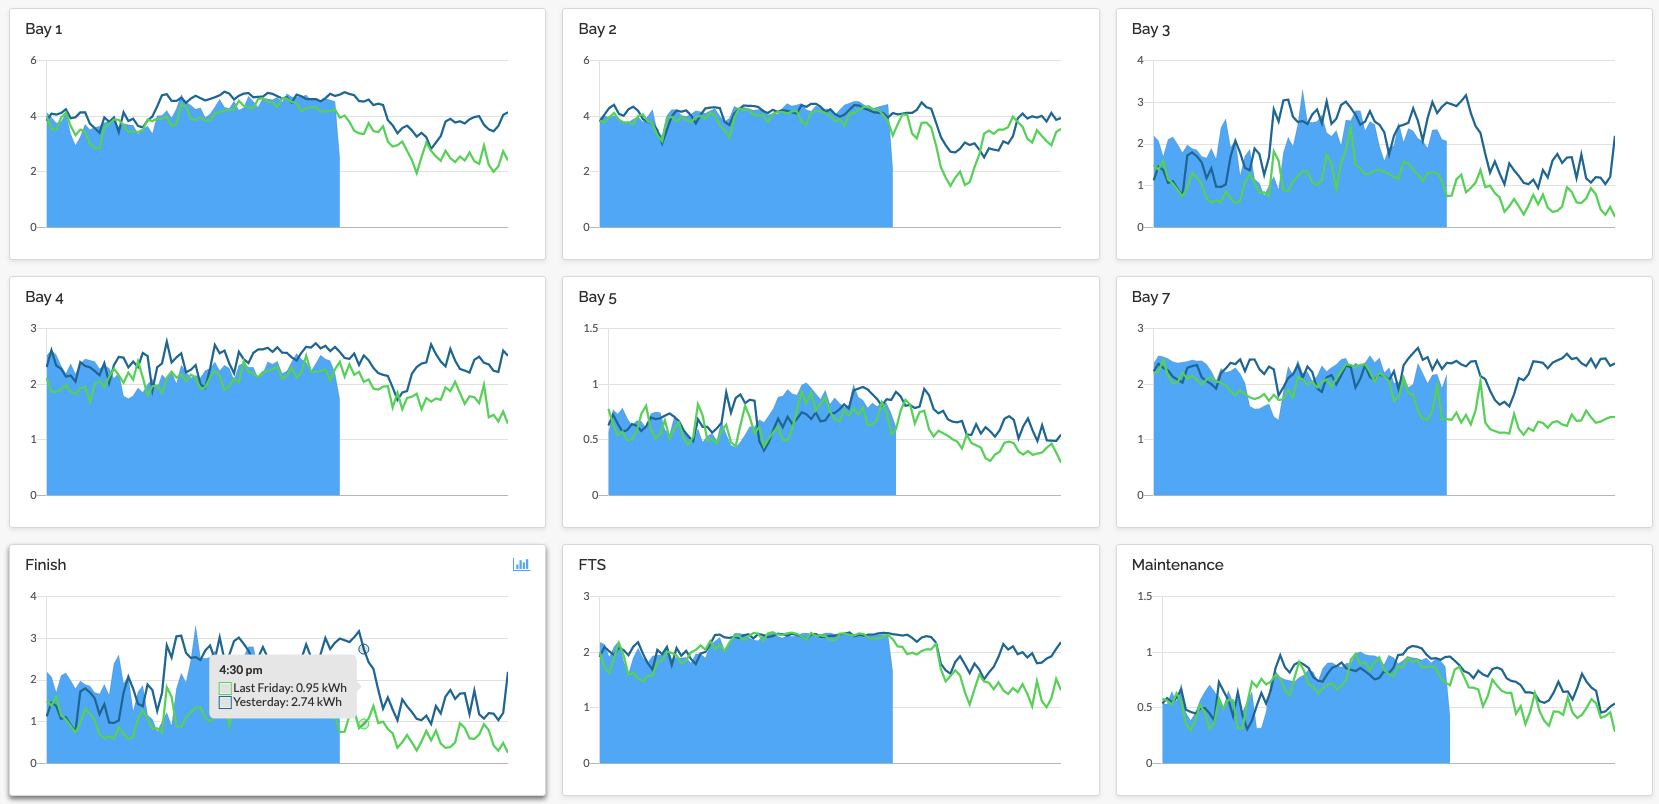
Tagged Mini Charts
Similar to the Full Site Energy Usage Comparison Chart, these display custom Tags configured by an Admin user.