How To - Run Energy and Occupancy Reports
 Updated
by
Steve Corbesero
Updated
by
Steve Corbesero
How does SiteWorx Analyze collect data?
SiteWorx gathers data from intelligent lighting fixtures, Digital Light Agents, and other SiteWorx Devices and Sensors, reporting on that data using the following parameters:
- Lights record detail about when they are in "active" power level and "inactive" power level modes.
- Lights record details about occupancy sensor events.
- SiteWorx Tune polls all lights, retrieving detailed log information on a 15-minute cycle.
- Lighting specific reports are available for
- Energy Usage (kWh)
- Occupancy (time occupied as a percentage of total time)
- Active Percentage
- Occupancy vs. Energy
- Active Percentage vs. Energy
- Data is available as a total Site aggregate OR via custom Tag reports.
Analyze automatically defaults to a 30 Day Full Site Energy Usage report
Running a Tagged Report
- Click the Analyze Icon on the Application Navigation menu
- Select the Site
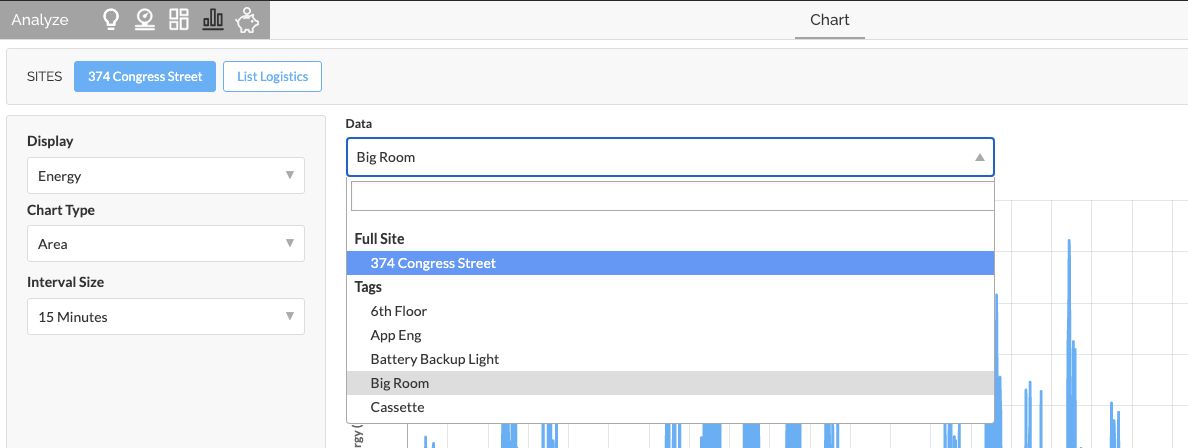
- Select the Tag or Full Site from the Data dropdown menu
- To create custom Tags, review How To - Create an Analyze Tag Report
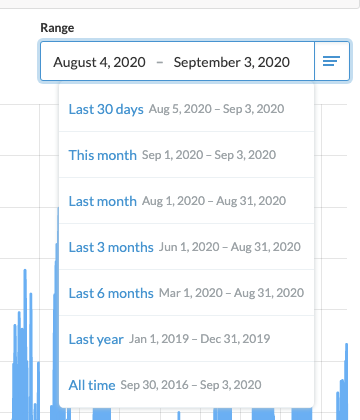
- Select the Date Range
- Access the drop down for a preset range
- Enter specific dates in manually
- Drag the navigator below the chart
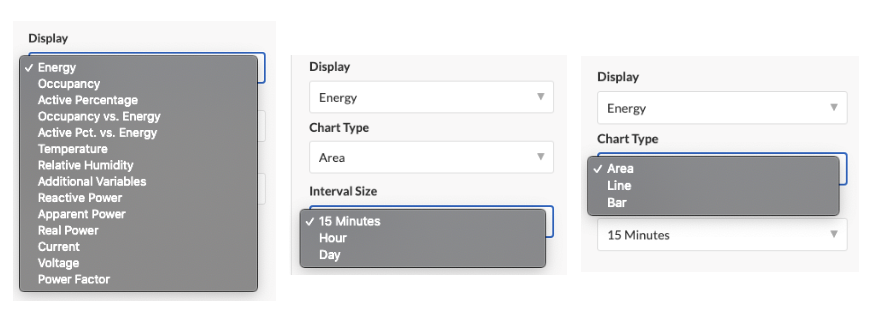
- Adjust the display features to select the data type, chart type, and interval size
To export data, click the Export CSV button located under the display options