SiteWorx Insights #5 — Analyze
 Updated
by
Siteworx Marketing
Updated
by
Siteworx Marketing
SiteWorx Analyze — Identify and report on energy-saving achievements
SiteWorx Analyze helps customers examine and understand data and insights from their facilities. The easy-to-use data visualization tools let customers interact with various types of data gathered from devices within the facility and compare important details to find new energy-saving opportunities.
Customers can create their own charts or choose from a number of predefined options, such as the Occupancy vs. Energy chart shown below which helps compare facility occupancy levels with the actual energy consumed.
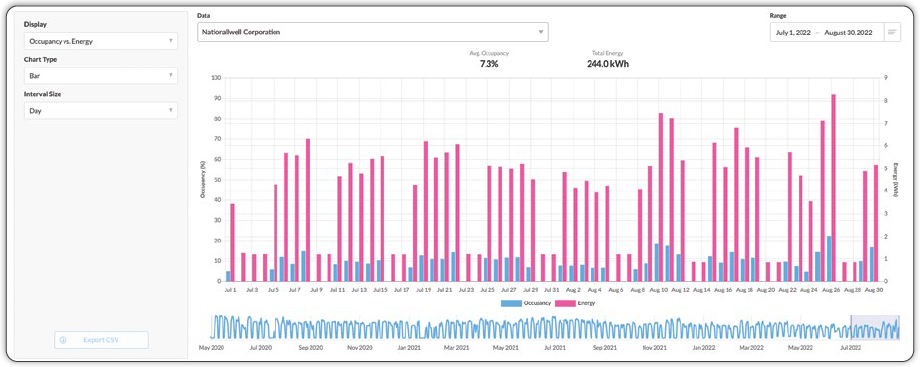
The Occupancy vs. Energy chart in SiteWorx Analyze helps you easily identify important facility trends.
Customers can easily spot outliers or changes in trends such as high energy use with low or no occupancy in a site or an area which helps make data-driven decisions about how to best manage energy. Occupancy trends can even be helpful for making changes to HVAC schedules or powering down non-essential tools and equipment during off-hours.
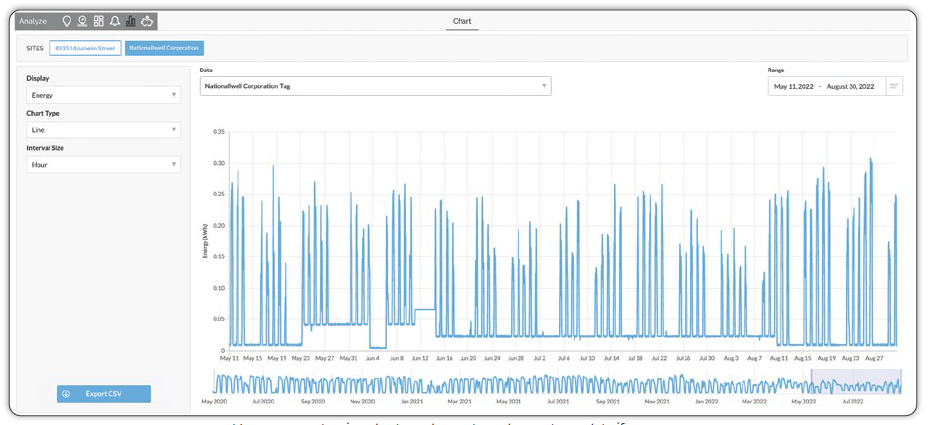
Users can customize charts and reports and export raw data if necessary.
Users can modify a number of visualization parameters, including data type and data combination, reporting interval, and specify a date range, including the full facility data history. The fully interactive tool has an easy range navigator and mouse-over datapoint labels for further analysis. SiteWorx Analyze also includes an export feature that creates and downloads a .CSV file, including all of the data from the configured parameters.
Energy and other data can be historically analyzed for any SiteWorx device, not just lighting. Use SiteWorx Analyze to put your facility data to work and find new savings opportunities.
SiteWorx Insights brings real-world functions and capabilities available to all subscribers of the SiteWorx Application Suite.