Navigating the SiteWorx Savings Dashboard
Navigating to the SiteWorx Savings Dashboard
The SiteWorx Savings Dashboard contains specific Site and Tag-based Savings data for your Organization. To navigate to the SiteWorx Savings Dashboard, you can
- Click the last option on the Application Navigation menu

- Click the Site specific Savings card on the Tune Dashboard to go directly to a Site's Savings Chart

Multi-Site Organizations
For multi-site Organizations, the Savings Dashboard displays the Total Savings for the entire Organization and individual Site-specific sections. The Organization section displays:
- Total kWh saved,
- Energy & Occupancy usage trends, and a
- Site Savings Pie Chart

Each site-specific section contains the energy and cost savings metrics, site trends, and savings equivalency figures.

In addition to the site-specific savings information, Tag-based savings are also available.

Reviewing the SiteWorx Site Savings Report
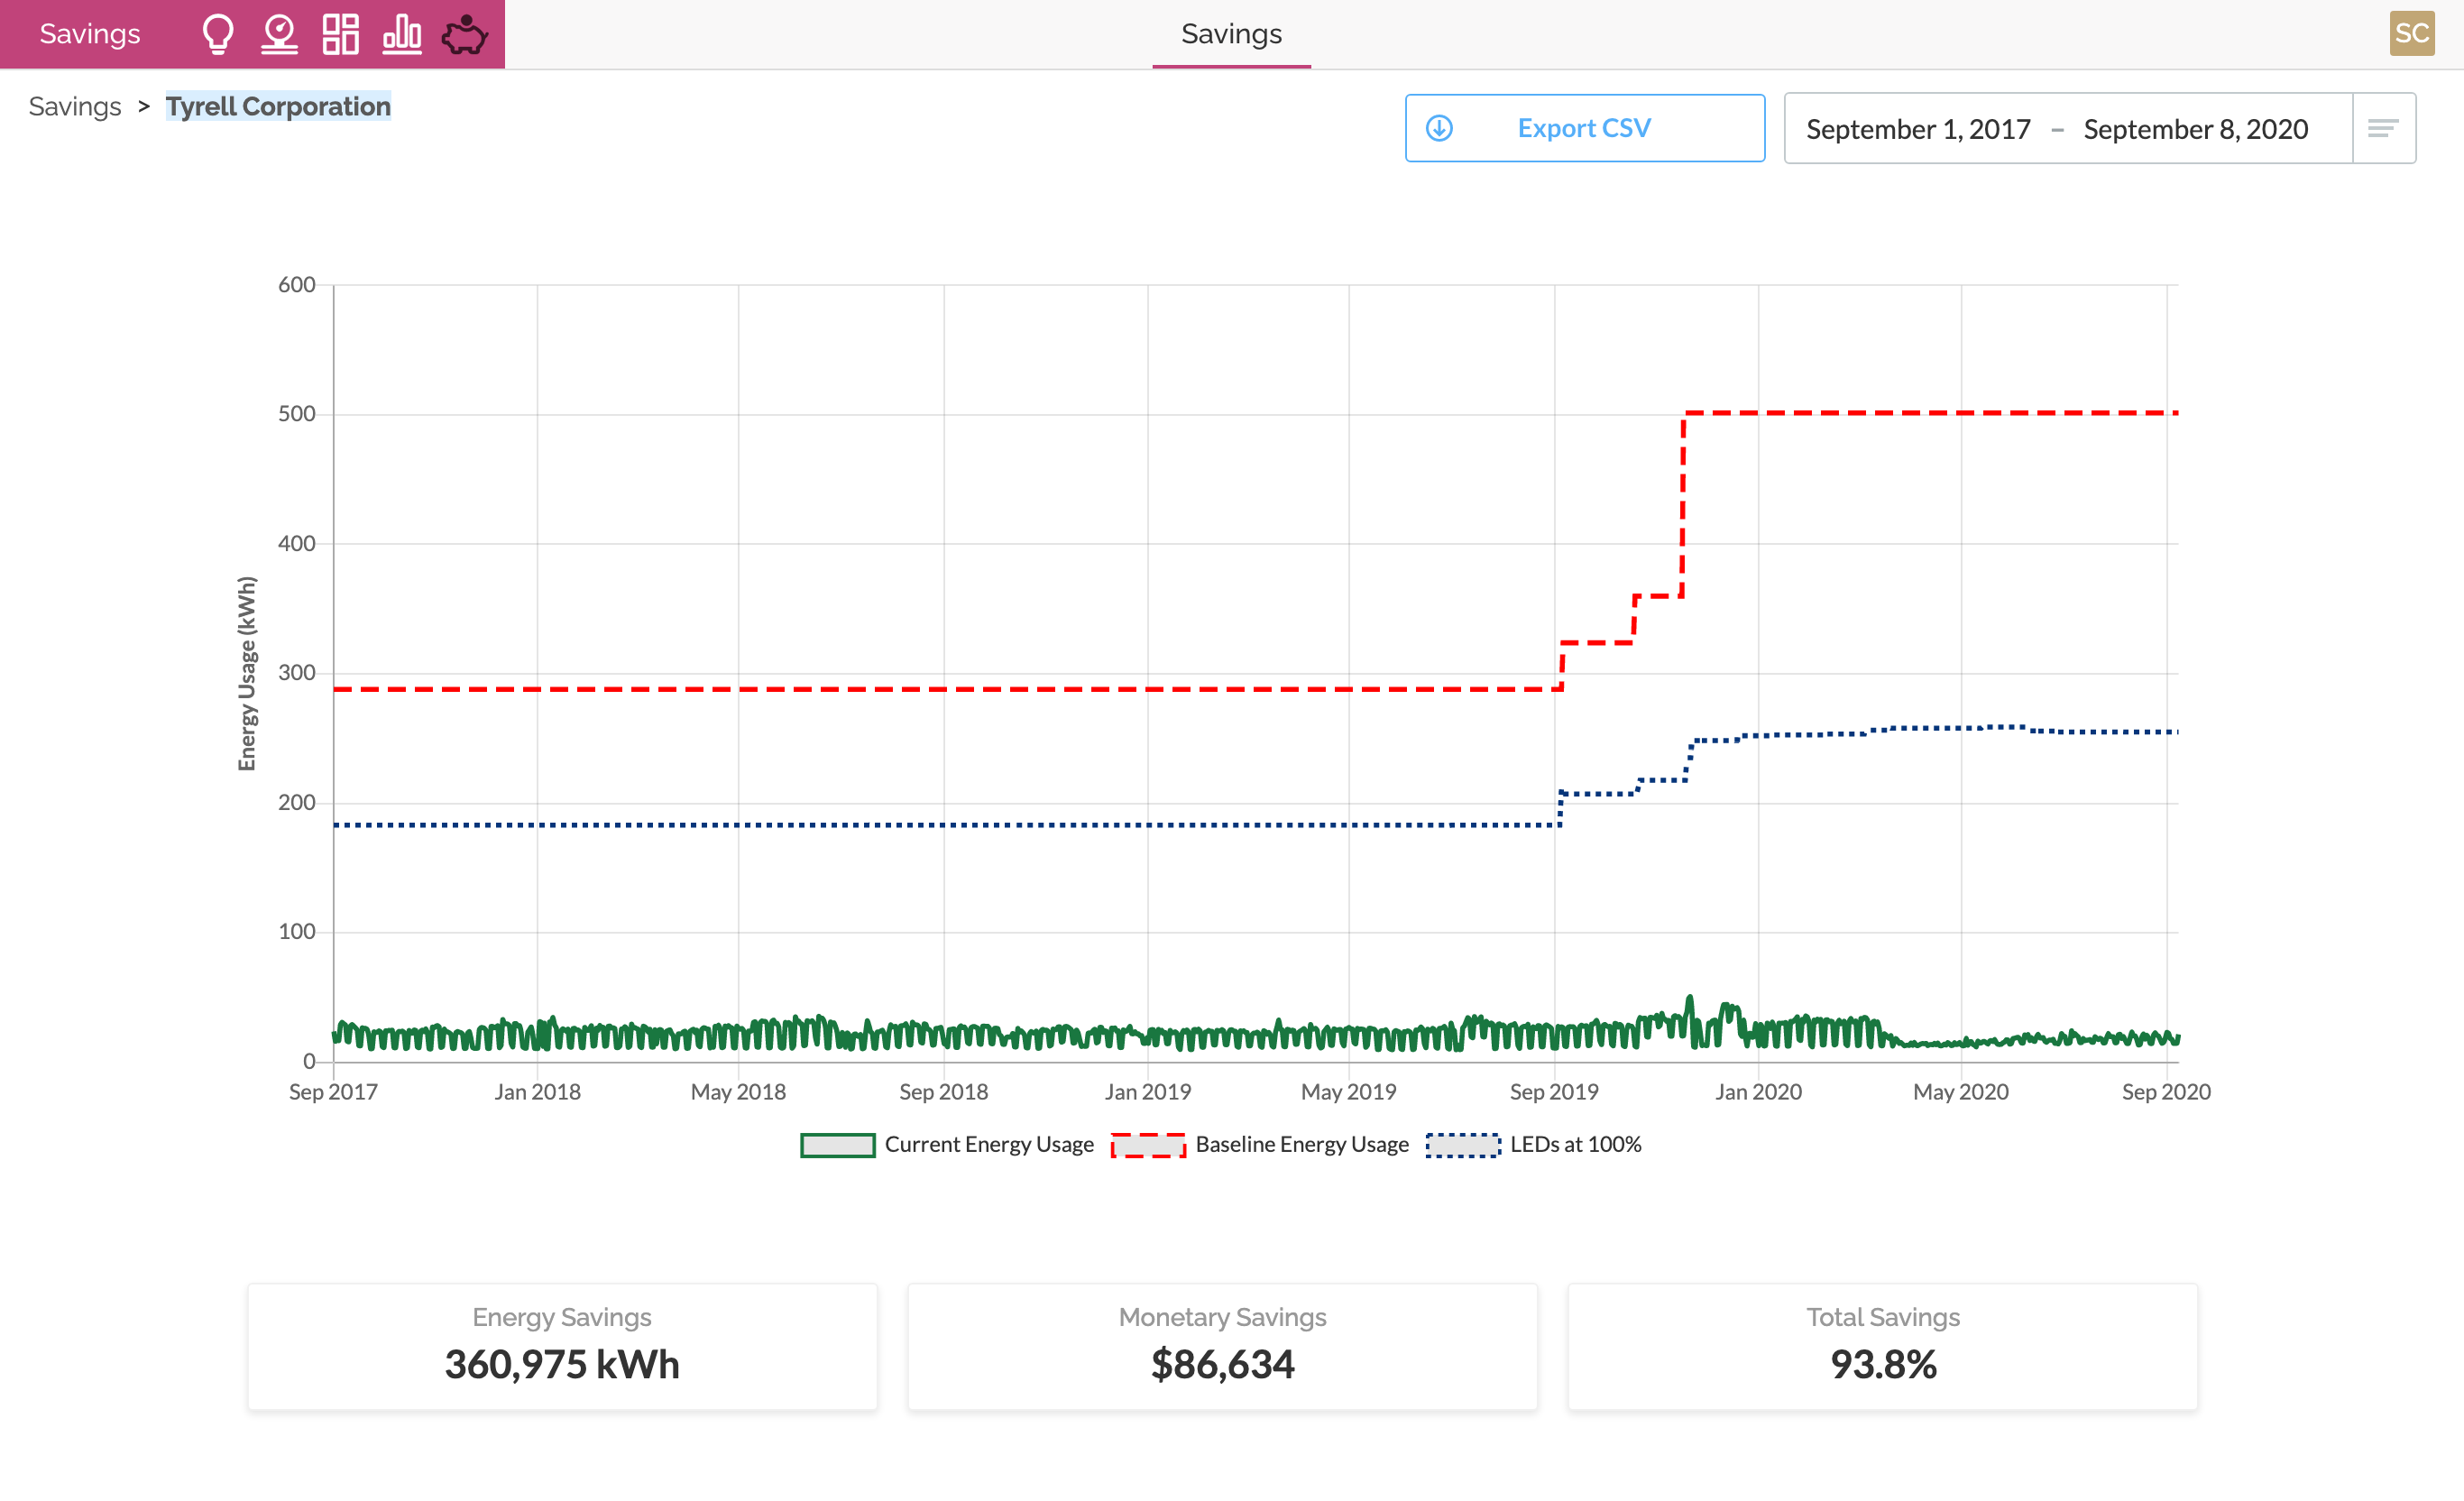
The SiteWorx Site Savings Report includes data series to compare actual energy usage of the SiteWorx Tune versus the previously installed baseline as well as the baseline power of LEDs at 100% brightness.

The data is rolled up into an energy usage calculation and displayed on the Site Savings graph as an additional line to show how upgrading lighting to LEDs and adding the advanced lighting controls in SiteWorx play a significant role in reducing energy consumption.

