Navigating the SiteWorx Sense Dashboard
 Updated
by
Steve Corbesero
Updated
by
Steve Corbesero
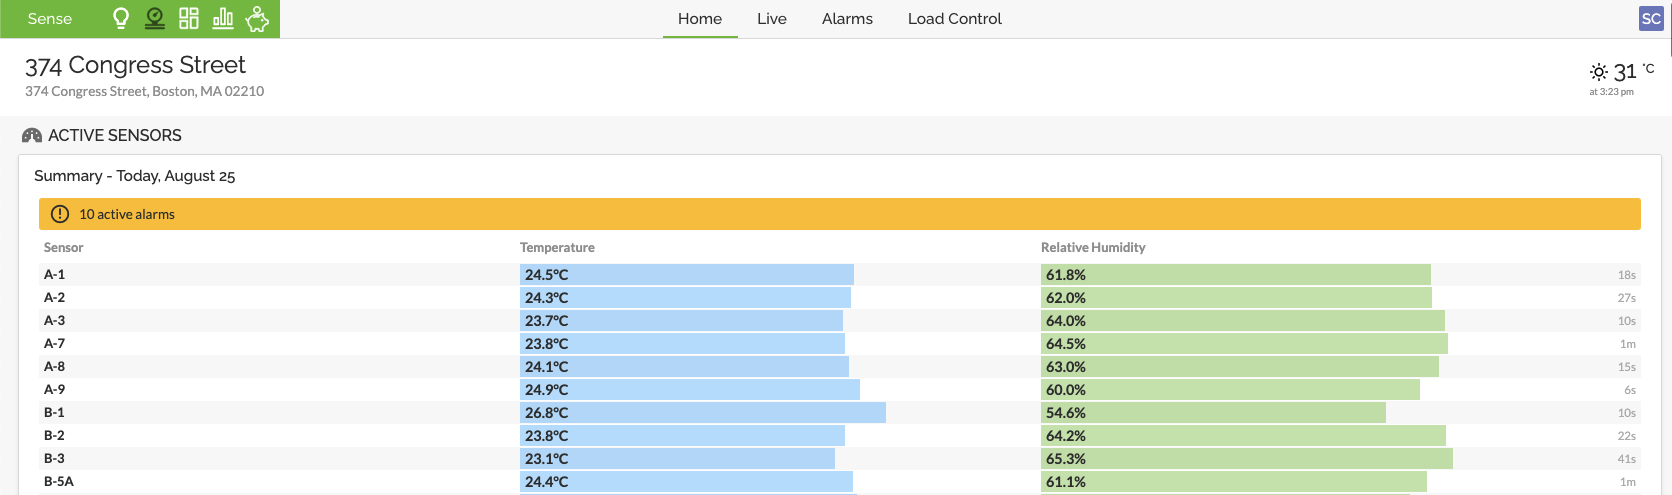
The SiteWorx Sense Dashboard showcases real-time, point of use sensor data to enable users to unlock operational insights, minimize risk, and create new efficiencies. Similar to the Tune Dashboard, the Sense Dashboard is displays segments containing sensor datasources by Site. Each section includes an Active Sensors table, a widget with the current weather, and sensor-specific usage charts or cards.
In the Application Navigation menu, there are links to:
- SiteWorx Sense Live View - Visualize your facility's sensor data in real-time.
- SiteWorx Sense Alarms - View active and previously active alarms, and create new or edit existing alarms and subscriptions.
- SiteWorx Sense Load Control - Configure a relay device (Smart Cord or Wireless I/O) to open or close in response to trigger node occupancy.
Active Sensors Table
The Active Sensors Table displays real-time sensor data feeds from each connected SiteWorx native Temperature and Relative Humidity Sensor and other instantaneous sensor datasources hosted by the Wireless I/O Module. Each feed updates automatically based on the configured sampling frequency at the time of commissioning, and a last updated timestamp is shown on the far right of each entry.
If SiteWorx Sense Alarms are configured, a visual Alarm indicator will appear for any Active Alarms.
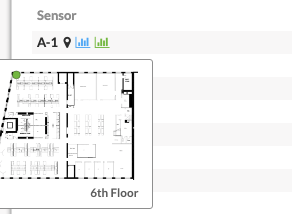
Hovering over a specific sensor datasource will reveal its relative location on the facility floor and link to the historical data chart in Analyze.
Power Meter Usage Cards
All Power Meter type datasources are treated with cumulative energy usage cards broken down into Daily, Weekly, and Monthly aggregates. Devices that support this type of output include the SiteWorx native Power Meter, Wireless I/O Module with compatible Modbus Power Meter, and Smart Cord.
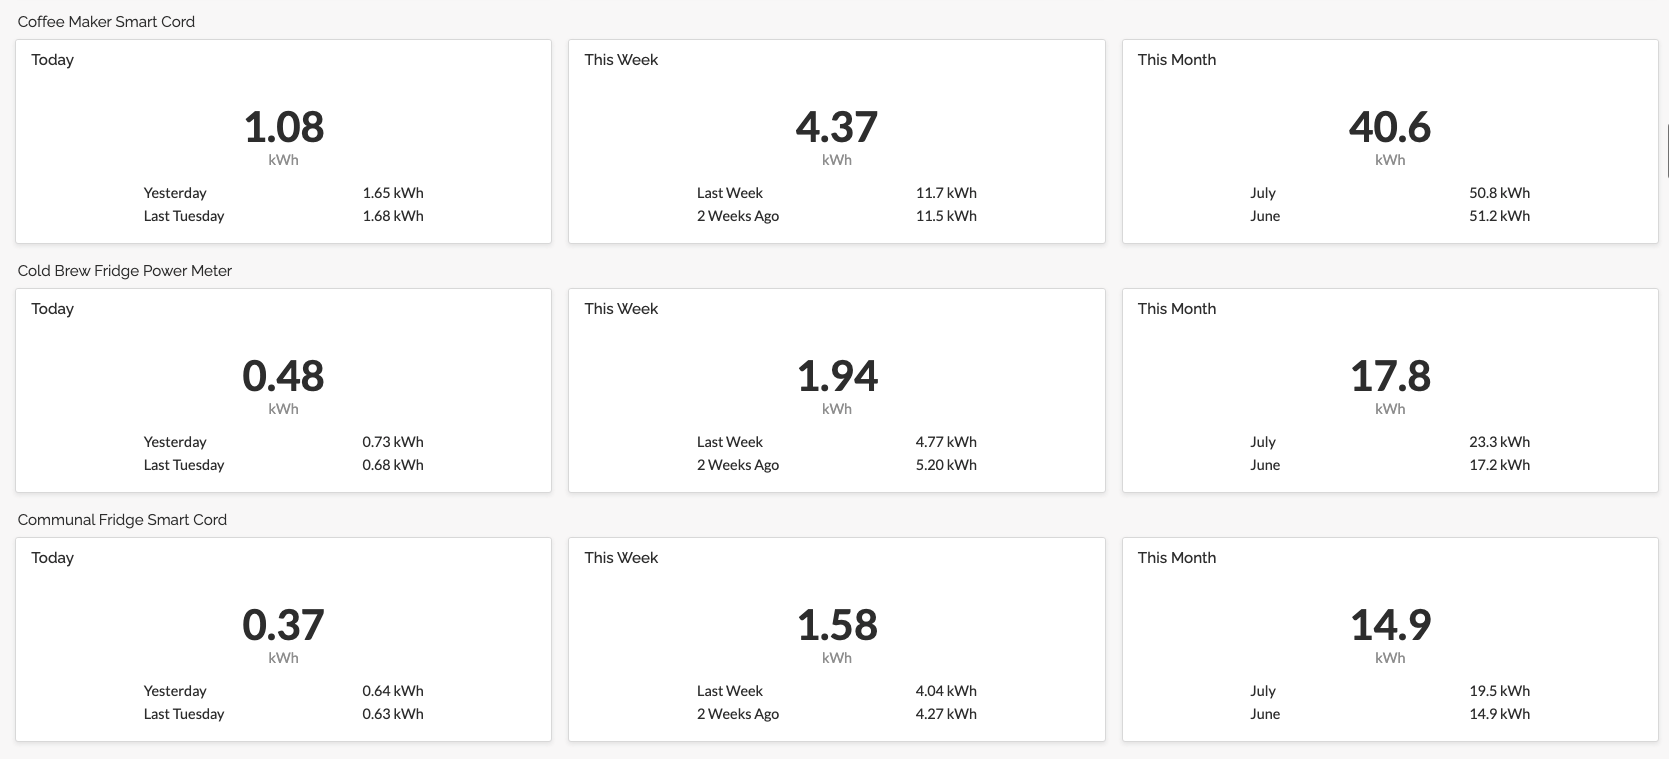
Like the Energy Usage cards on the SiteWorx Tune Dashboard, hovering over the energy usage value will link to the associated historical energy usage report in SiteWorx Analyze.
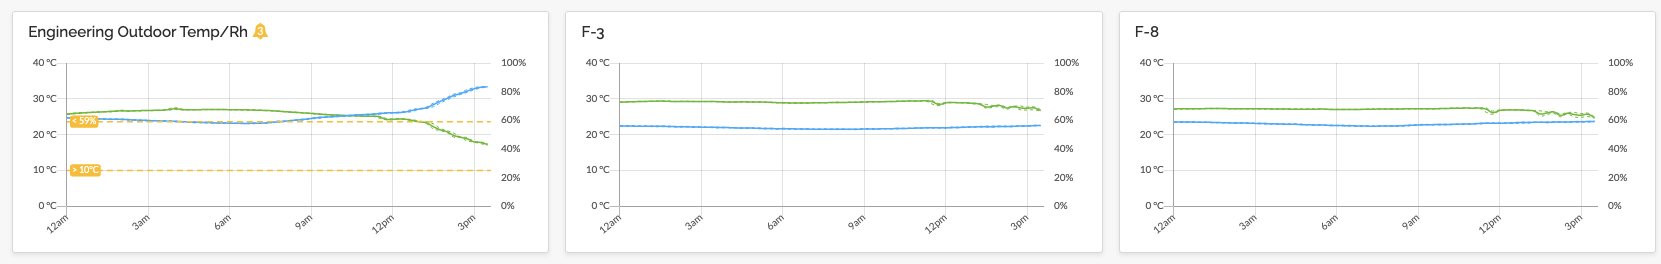
Daily Usage Mini Charts
All instantaneous SiteWorx Sense datasources are treated with a 24-hour line chart to ensure all monitored data streams are in regular operation. If a sensor datasource has an active alarm, an icon appears next to its name, and a dotted yellow line on the chart shows the alarm’s activation threshold.
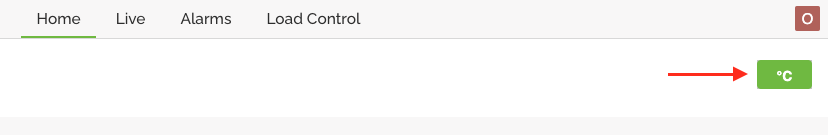
Toggle Between Celsius and Fahrenheit
Click the green icon in the top-right to change the units of temperature on the Sense Dashboard. The icon will change between °C and °F to indicate the current units.