Tune Savings Dashboard
The Savings Dashboard aggregates Organization-wide lighting system savings information into a single panel.

To enable Site-level Savings features, please review Configure Site Savings.
To enable Tag-level Savings features, please review Configure Tag Savings.
Navigating the Savings Dashboard
The SiteWorx Savings Dashboard contains specific Site and Tag-based Savings data for your Organization. To navigate to the SiteWorx Savings Dashboard, you can either:
- Click the Savings Tab on the Application Navigation menu

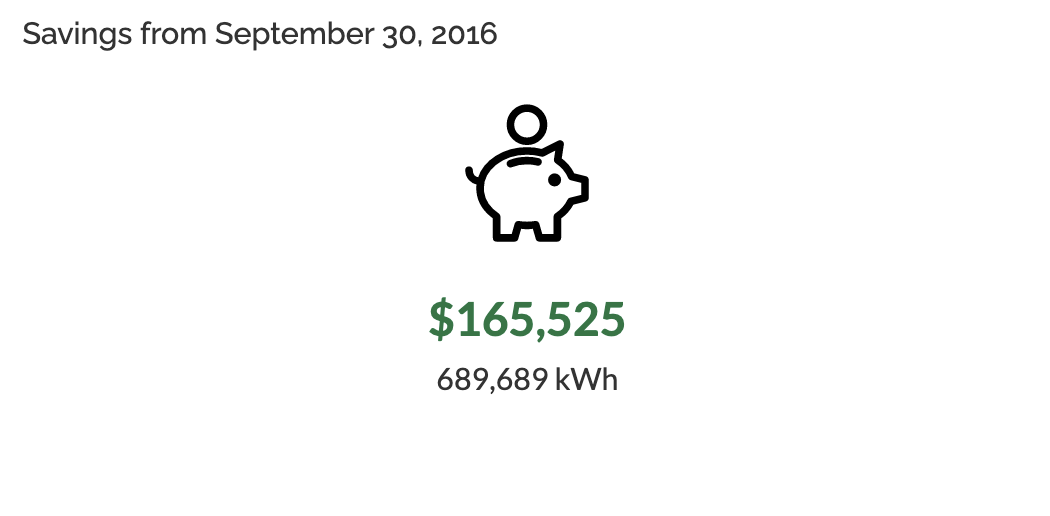
- Click a Site-specific savings card on the Tune Dashboard to go directly to a Site's savings chart
Dashboard for Multi-Site Organizations
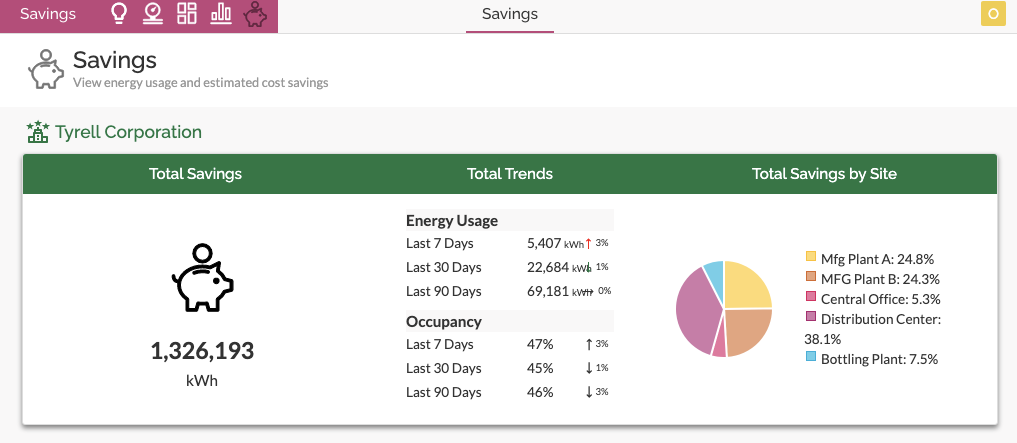
For multi-site Organizations, the Savings Dashboard displays the Total Savings for the entire Organization and individual Site-specific sections. The Organization section displays:
- Total kWh saved
- Energy & Occupancy usage trends
- Site Savings Pie Chart
Thereafter, each Site has a site-specific section that contains the energy and cost savings metrics, site trends, and savings equivalency figures.
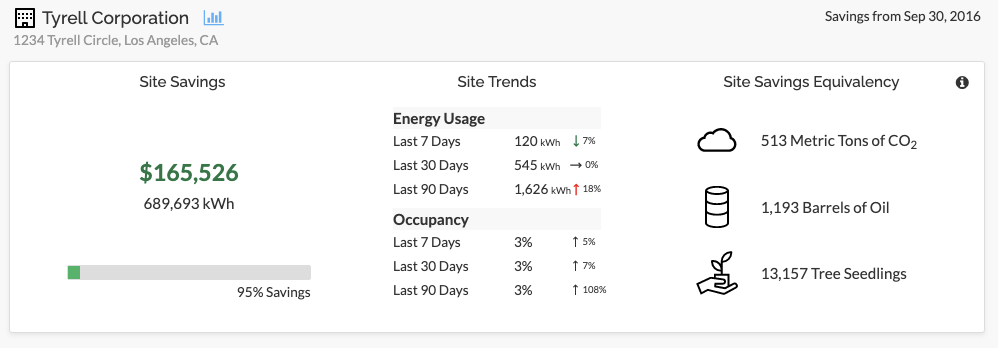

Click the chart icon next to the Site name to view the Site Savings report.
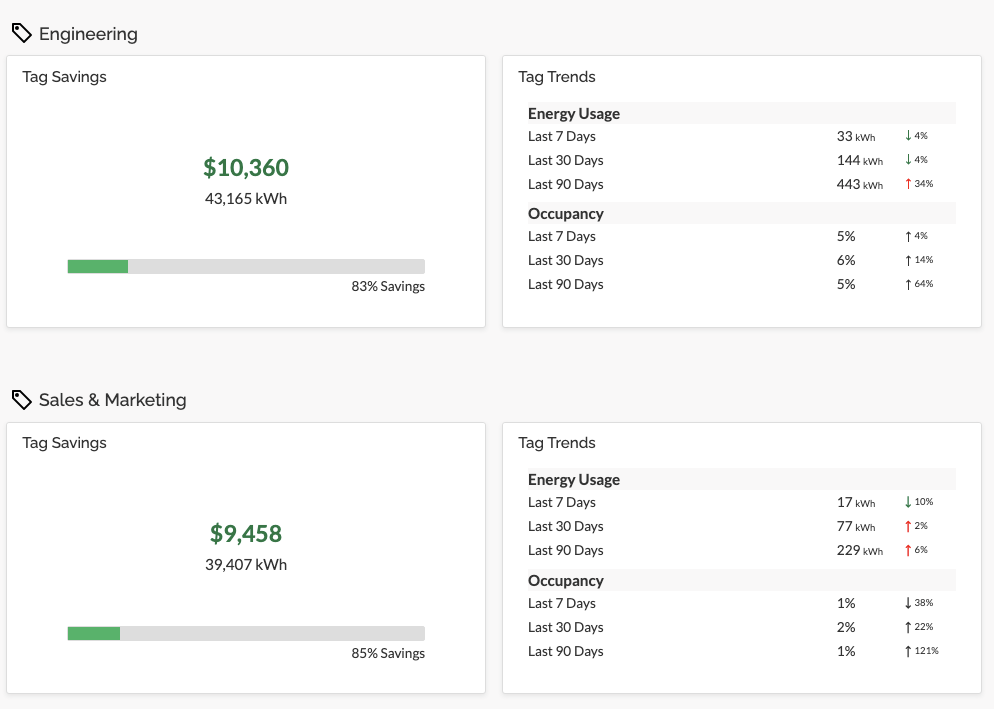
In addition to the site-specific savings information, Tag-based savings are also available.
Reviewing the SiteWorx Site Savings Report
The data in the SiteWorx Site Savings Report includes:
- the Green line indicates the actual energy usage of SiteWorx Tune nodes
- the Blue line indicates the baseline power of all LEDs connected to SiteWorx Tune at 100% brightness (baseline of using existing LEDs without controls)
- the Red line is the user inputted Site Baseline Lighting Power values inputted here (baseline of previous or alternate lighting system)
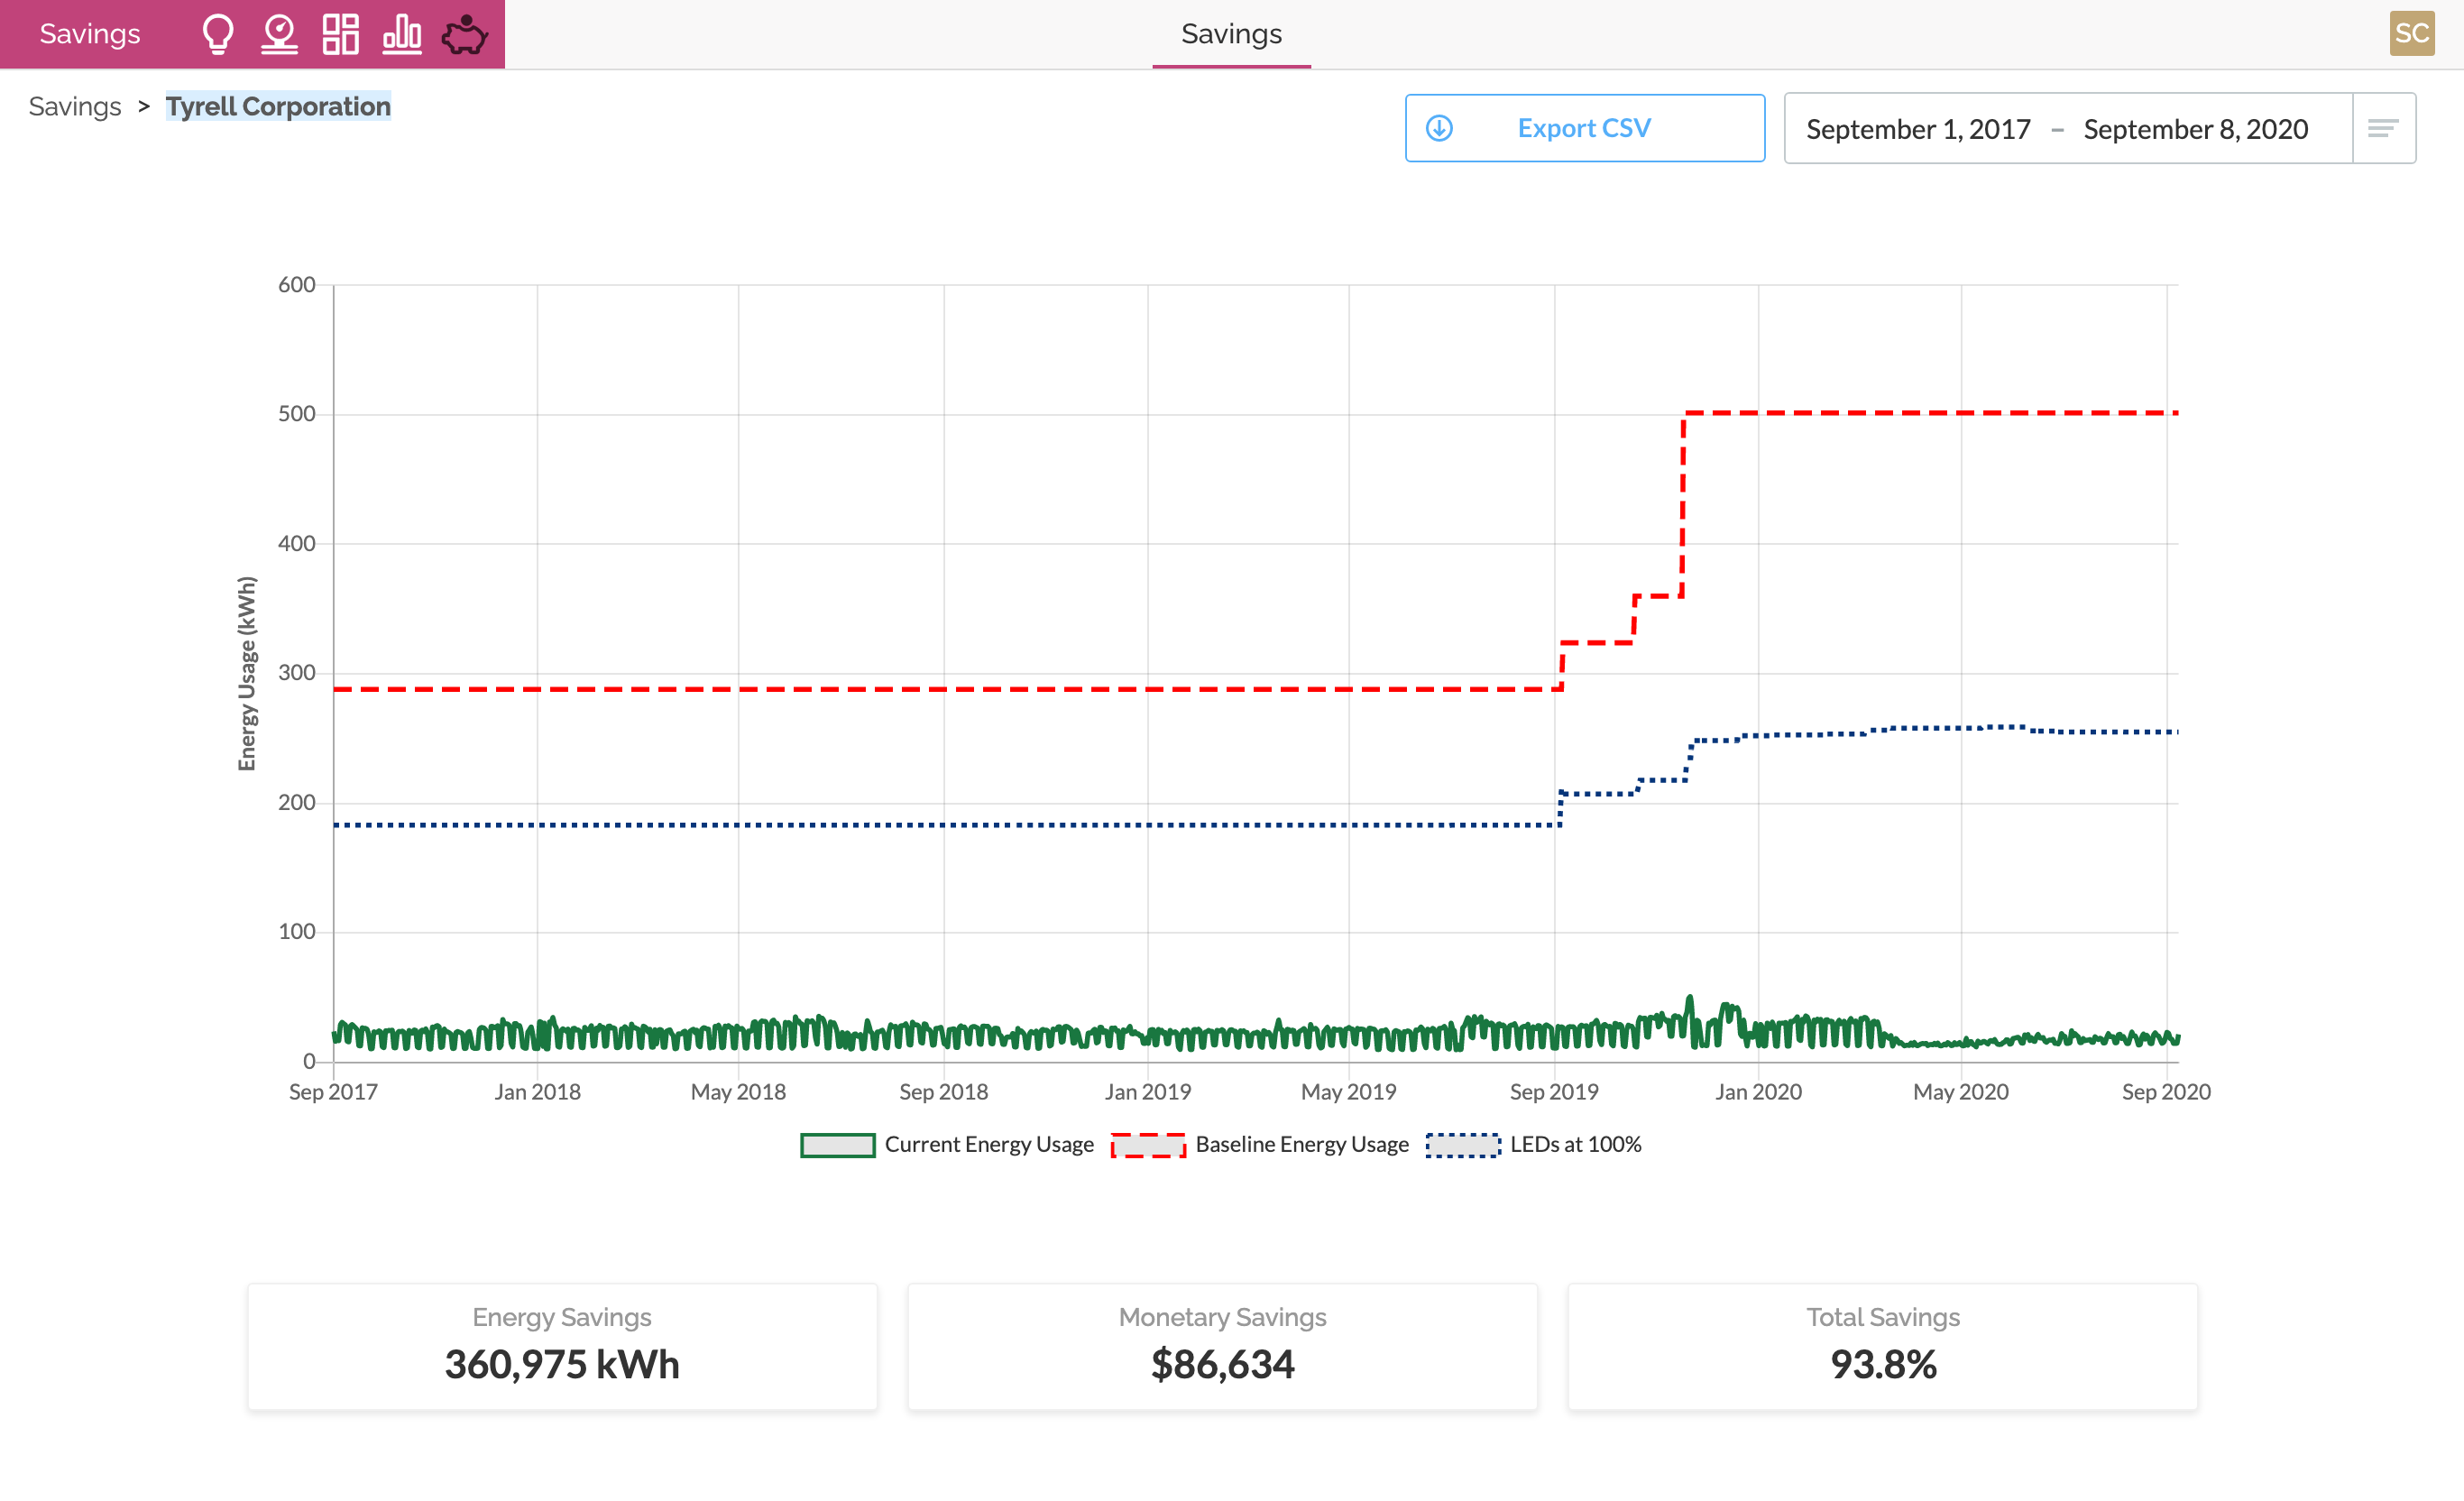
The data is rolled up into an energy usage calculation and displayed on the Site Savings graph as an additional line to show how upgrading lighting to LEDs and adding the advanced SiteWorx Tune lighting controls play a significant role in reducing energy consumption.
The LEDs at 100% data is included in the exported CSV file. The data can be downloaded in CSV format by clicking Export CSV
Related Articles
Navigating the SiteWorx Tune Dashboard
The SiteWorx Tune Dashboard showcases pertinent energy usage data across all connected sites under the organization, labeled under different segments. Each Site segment contains a collection of data cards representing different energy usage metrics, ...Tags in SiteWorx
Overview of Tags A Tag is a user-defined collection of lighting fixtures/sensors used for data reporting. Tags allow users to quickly create granular reports on specific areas of a facility to hone in on trends. You can find the Tag Manager in the ...Configure Tag Savings
To enable Tag Savings: Navigate to the Admin Console Click Tags Click the target Site from the list (if applicable) Select the appropriate Tag Enter the Baseline Lighting Power (W) The Tag Baseline is the total wattage from the previously installed ...Configure Site Savings
Before users can take advantage of the SiteWorx Savings Dashboard, an Admin must add site-level variable baseline lighting power (pre-retrofit lighting) and local energy costs. To enable Site Savings: Navigate to the Admin Console Click Sites Click ...Configure Task Tune Lighting Settings
Understanding Task Tune: Precise Lighting Control Managing your facility's energy footprint requires a balance between safety and efficiency. Task Tuning in SiteWorx allow you to manage precise lighting parameters on individual fixtures or entire ...