Navigating the SiteWorx Tune Dashboard
The SiteWorx Tune Dashboard showcases pertinent energy usage data across all connected sites under the organization, labeled under different segments. Each Site segment contains a collection of data cards representing different energy usage metrics, or charts for that specific Site. Each data card updates every 60 seconds with the most up-to-date information.
The below data cards are available for display on the dashboard.
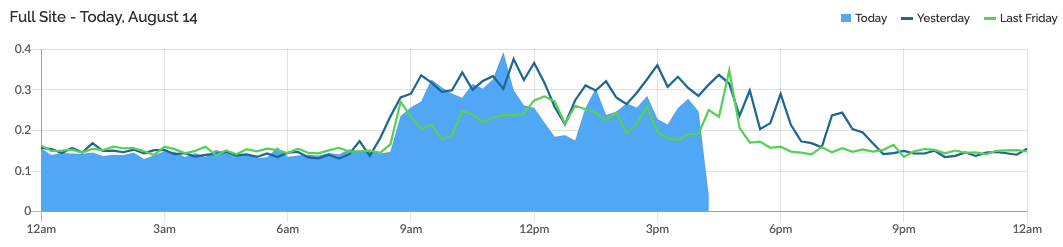
Full Site Energy Usage Comparison Chart
Compares the current days' energy usage across the full Site against the energy usage of one day, and seven days prior.
Total Savings Widget
Displays the total amount of savings since SiteWorx was deployed. By clicking the dollar amount links to the SiteWorx Savings report SiteWorx Analyze.

To see this widget, ensure Site Savings is configured.

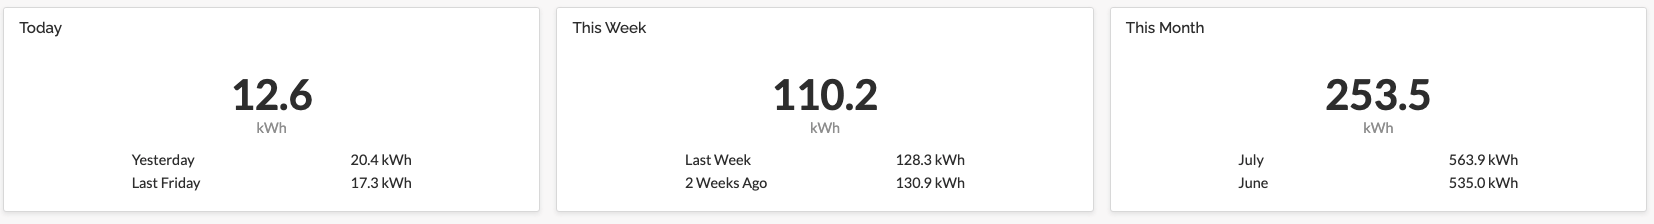
Energy Usage Snapshots
Displays the full Site's aggregated energy usage for the day, week, and month.
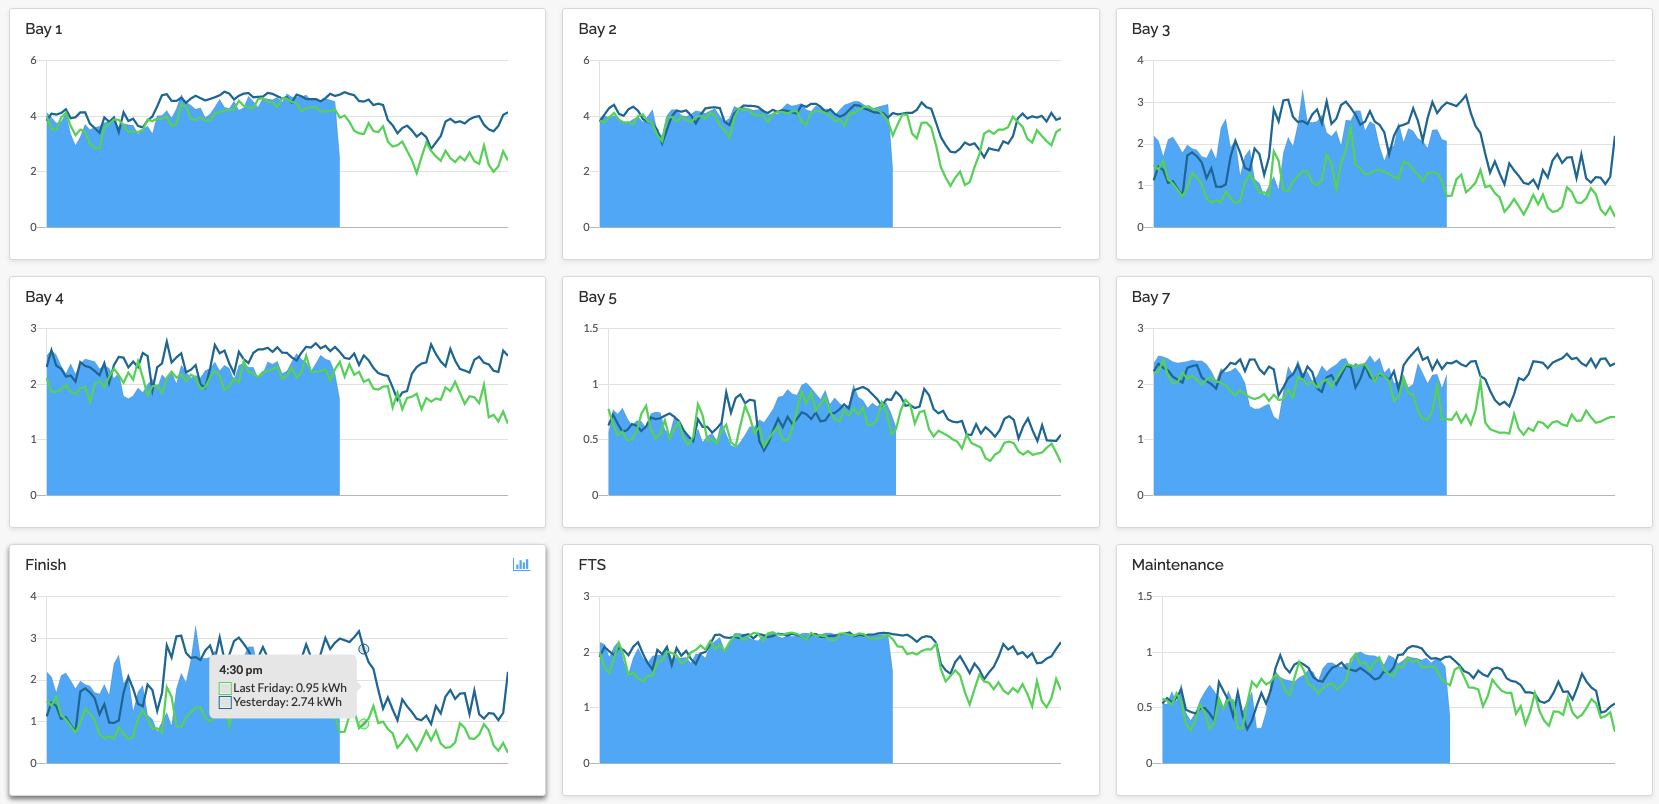
Tagged Mini Charts
Similar to the Full Site Energy Usage Comparison Chart, these display custom Tags configured by an Admin user.
For more information on Tags, refer to the Tag Overview.
Related Articles
Navigating the SiteWorx Sense Dashboard
The SiteWorx Sense Dashboard showcases real-time, point of use sensor data to enable users to unlock operational insights, minimize risk, and create new efficiencies. Similar to the Tune Dashboard, the Sense Dashboard is displays segments containing ...Tune Savings Dashboard
The Savings Dashboard aggregates Organization-wide lighting system savings information into a single panel. To enable Site-level Savings features, please review Configure Site Savings. To enable Tag-level Savings features, please review Configure Tag ...Getting Started - Tune
After completing Account Setup, get familiar with SiteWorx Tune. Tune is a simple, powerful lighting control application that uses sensor-based intelligence to maximize energy savings, improve productivity, and maintain safe and comfortable light ...Configure Task Tune Lighting Settings
Understanding Task Tune: Precise Lighting Control Managing your facility's energy footprint requires a balance between safety and efficiency. Task Tuning in SiteWorx allow you to manage precise lighting parameters on individual fixtures or entire ...Tune Live View
The SiteWorx Tune Live View is a real-time stream of occupancy data received from each light fixture or sensor. The Live View enables users to monitor real-time occupancy behavior across their facility. Clicking the Live button on the Feature ...