Sense Live View
The SiteWorx Sense Live View is a real-time stream of data reported by each SiteWorx sense device or data source. The Live View enables users to monitor real-time sensor behavior to ensure the facility is operating normally.
Clicking the Live button on the Feature Applications Menu takes the user to the Site and Area picker.
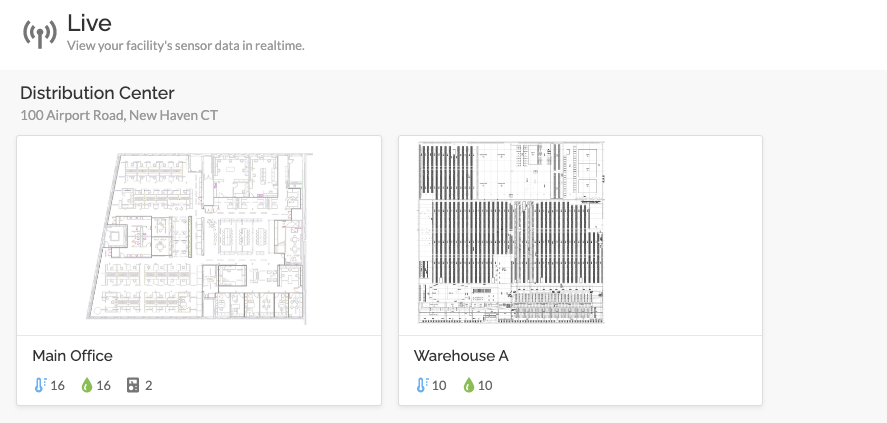
Selecting an Area or Site displays that locations' specific Live View—each of the following Live View elements updates in real-time without requiring a page refresh.
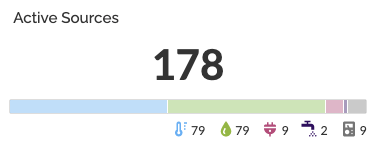
Active Sources
Active sources displays the current number of active data sources that have recently reported data to SiteWorx. This card updates automatically with a breakdown of each data source type.
Temperature & Relative Humidity Bee-swarm Chart
The Temperature and Relative Humidity Bee-swarm chart displays all temperature and relative humidity data sources updating in realtime. This chart is handy to identify TRH sensors outside of their normal range and could indicate environmental issues.
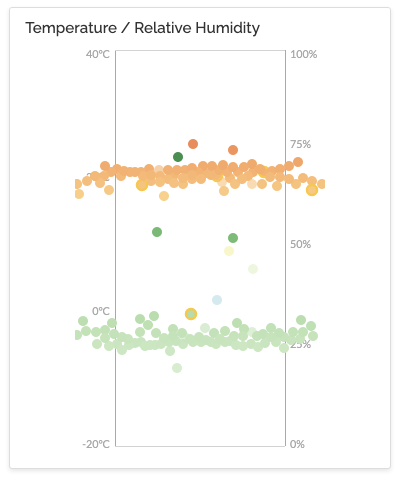

A beeswarm plot shows the distribution of a given variable while also showing each data point.
Live Map
The Live Map provides an overhead visualization of facility wellness within the facility, with real-time variations in data source readings. A subtle animation displays when a new data point is received for a specific sensor, dependent on the reporting frequency per each Sense device.
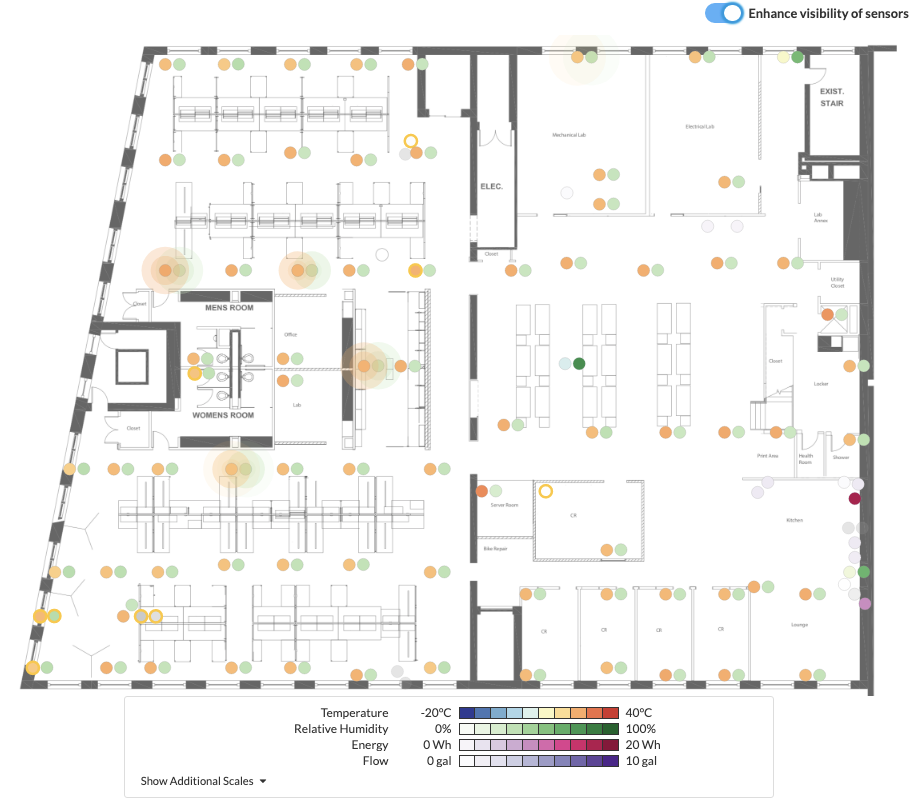
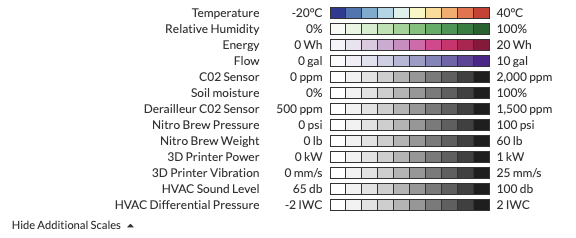
Underneath the Live Map is a data source legend that displays the color variance for each sensor range.
The Enhance visibility of sensors toggle collapses or expands multi-data-source Sense devices such as TRH sensors.

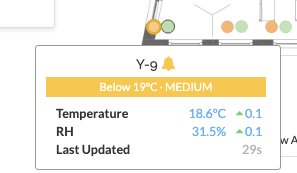
Each data-source is interactive. Hovering over any data-source reveals a pop-up that displays:
- If an alarm is active
- Latest data point and deviation from the previous data point
- Time since the last update
Related Articles
Use Case: Sense Live View
SiteWorx Sense Live View — for critical, at a glance facility data Monitoring an entire facility can be overwhelming in the best of times. The SiteWorx Sense Live View provides a simple, organized view of all critical sensor information in an ...Getting Started - Sense
After setting up SiteWorx Tune, get familiar with SiteWorx Sense. Sense is a facility-wide process monitoring application that utilizes SiteWorx Devices to help maintain facility wellness. Examples include monitoring temperature and relative ...Navigating the SiteWorx Sense Dashboard
The SiteWorx Sense Dashboard showcases real-time, point of use sensor data to enable users to unlock operational insights, minimize risk, and create new efficiencies. Similar to the Tune Dashboard, the Sense Dashboard is displays segments containing ...View Live Device Connectivity
Network Page Overview The Network page in SiteWorx provides a real-time, visual map of your facility's device connectivity. It allows any SiteWorx user to monitor the connectivity status of gateways, sensors, and lighting nodes at a glance. ...Tune Live View
The SiteWorx Tune Live View is a real-time stream of occupancy data received from each light fixture or sensor. The Live View enables users to monitor real-time occupancy behavior across their facility. Clicking the Live button on the Feature ...