Heatmaps Overview
Heatmaps provide complete sensor coverage of your building, enabling detailed occupancy and path tracking. Customizable reports deliver the insight you need to make data-driven decisions regarding optimized floor plans, inventory placement, and more.
The Heatmap report displays data as an overlay on the facility floor image, visualizing historical occupancy across the facility. Like other reports, the Heatmaps are fully customizable.
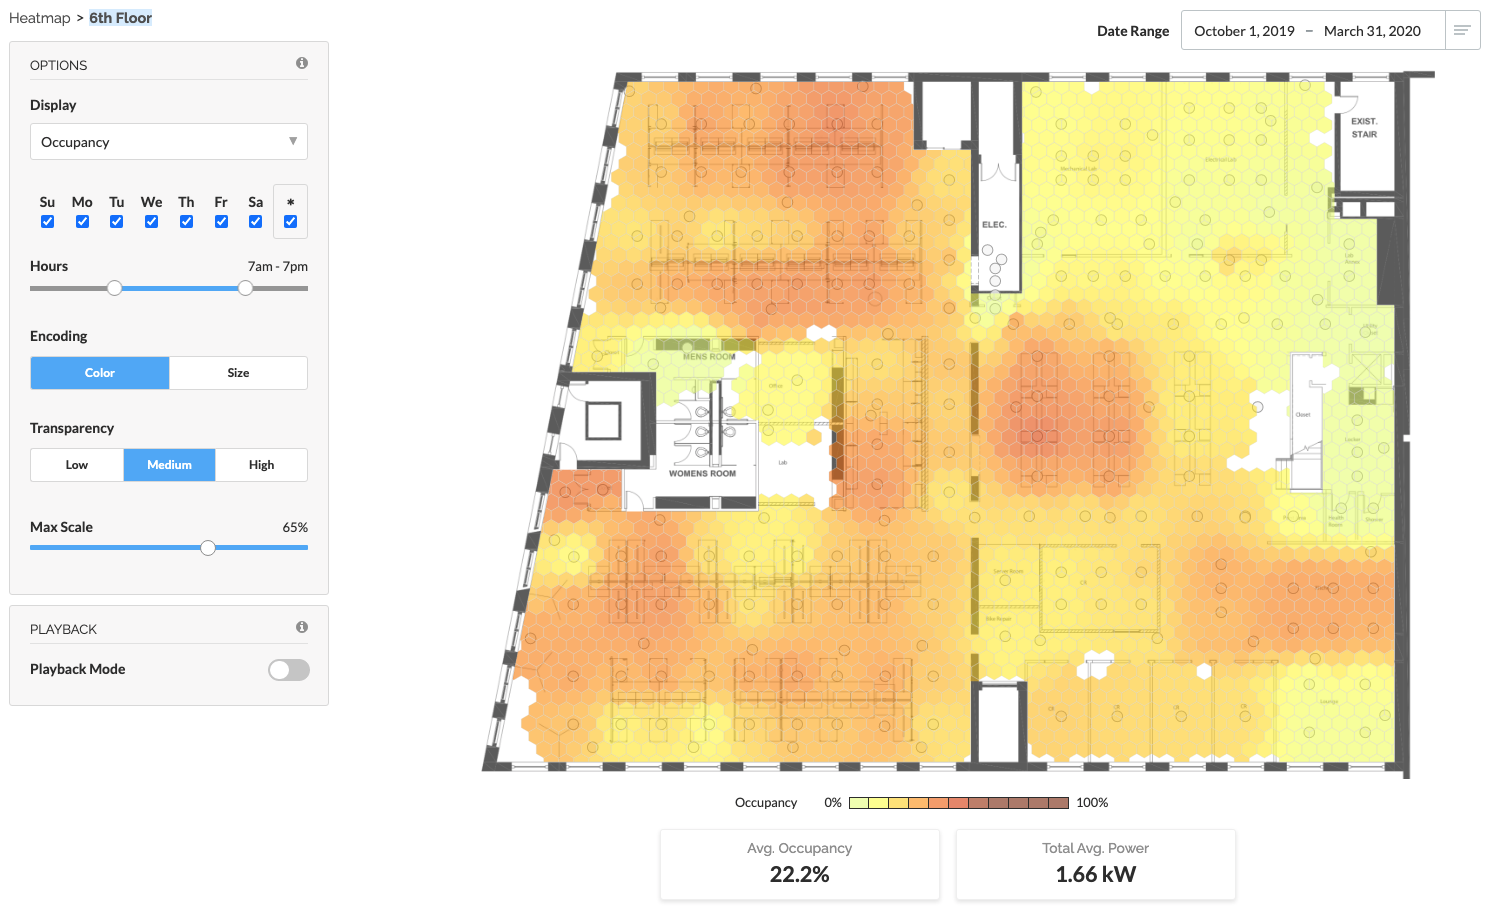
Users can adjust the date or time range, and the Heatmap tiles are configurable to visualize variations. Users can also use the Playback Mode to view how occupancy shifts over 24 hours.

Learn how to Run a Heatmap Report.
Playback Mode
Playback Mode is another powerful tool to visualize occupancy patterns throughout the day. By selecting the date range, days, and hours you would like to explore, SiteWorx creates a transitional animation of the occupancy patterns.
For example, to visualize the daily shift in occupancy patterns over a full 24 hours during the week, select the entire range on the Hours slider and applicable weekdays.
Interpreting the Heatmap
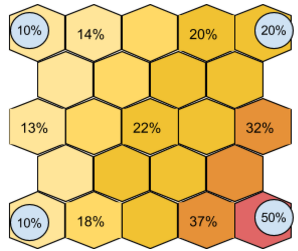
The Heatmap is a visual representation of data across space. That space is divided into hexagonal tiles whose values are not linked to a specific fixture. Instead, they are the result of a calculation of the values of nearby fixtures, adjusted by distance.
The value for a given tile is most heavily influenced by fixtures near the tile’s center, while less influenced by fixtures farther away. The number shown when hovering over a tile is the calculated value at the tile’s center.
The following image shows how closer lights have more influence:

Note: The summary data shown below the Heatmap represents the average value of all lights in the facility over the selected time range. It is not spatial like the heat map visualization.
Related Articles
Run a Heatmap Report
To navigate to Heatmap reports, select the Area icon from the Application Navigation menu, and then select the appropriate Site and Area. Running Heatmap Reports A default Heatmap report will load with the data from the last week. To further ...Getting Started - Area
After setting up SiteWorx Sense, get familiar with SiteWorx Area. Area is an occupancy and path tracking solution that delivers insight into how physical space can be better utilized and monitored. SiteWorx Area allows users to view the most active ...Analyze Overview
SiteWorx Analyze contains the reporting suite to help you gain insight into your business's operations, allowing you to increase productivity, maximize savings, reduce downtime, and improve business planning. SiteWorx gathers data from Tune lighting ...Setback Overview
Please visit Configure Lighting Settings (Setback) for guidance how to configure each Setback mode. Setback enables any site to capitalize and act on energy savings opportunities automatically. In combination with Task Tuning, Setback provides ...Overview - Scenes & Keypads
Overview When a keypad is commissioned & uploaded, it becomes available to SiteWorx Tune Admin users in the Admin screen. A user can then pair each keypad to a particular group. Alongside that, the user creates several scenes for that same group, ...