Analyze Overview
SiteWorx Analyze contains the reporting suite to help you gain insight into your business's operations, allowing you to increase productivity, maximize savings, reduce downtime, and improve business planning.
SiteWorx gathers data from Tune lighting fixtures and sensors as well as Sense devices and sensors. It reports on that data using the following parameters:
- Lights record detail about when they are in "active" power level and "inactive" power level modes
- Lights record details about occupancy sensor events
- SiteWorx Tune polls all lights, retrieving detailed log information on a 15-minute cycle
- Lighting specific reports are available for:
- Energy Usage (kWh)
- Occupancy (time occupied as a percentage of total time)
- Active Percentage
- Occupancy vs. Energy
- Active Percentage vs. Energy
- Data is available as a total Site aggregate OR via custom Tag reports
After selecting the Analyze icon from the application navigation menu, a 30 Day full-site energy usage report will load automatically.
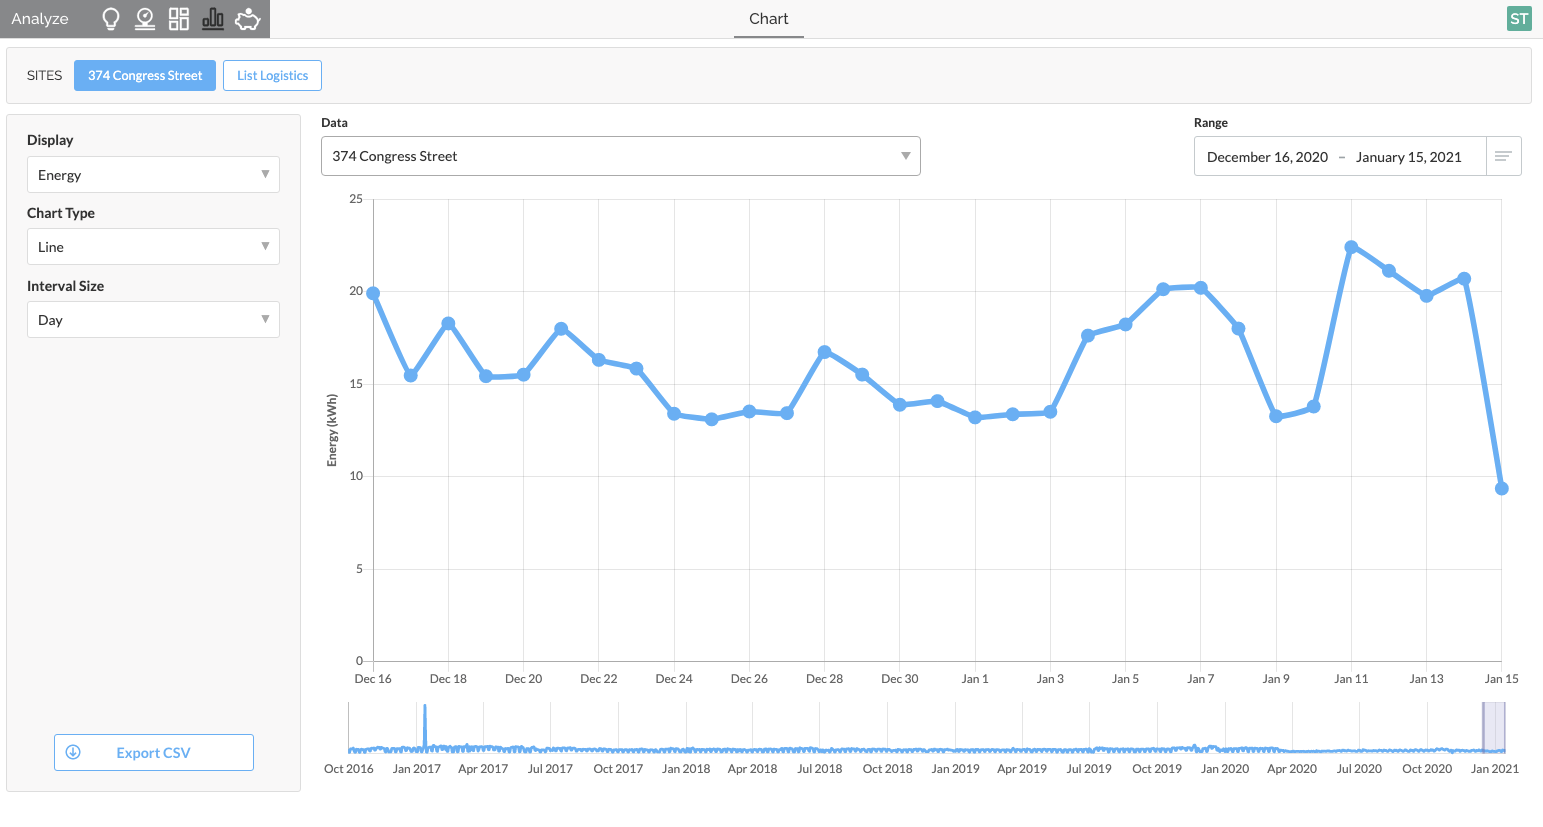
Chart Options
The Chart Options Panel contains three drop-down menus to select various data sources or chart types.
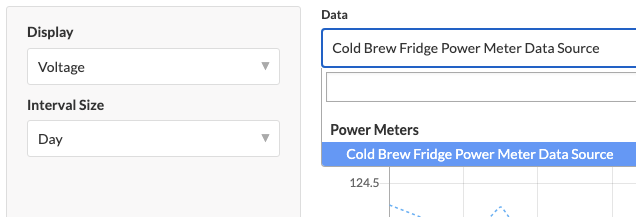
Display
The Display drop-down menu contains all data sources available for historical reporting.
Display As
Use the Display As drop-down menu to select the chart type; line, area, or bar.
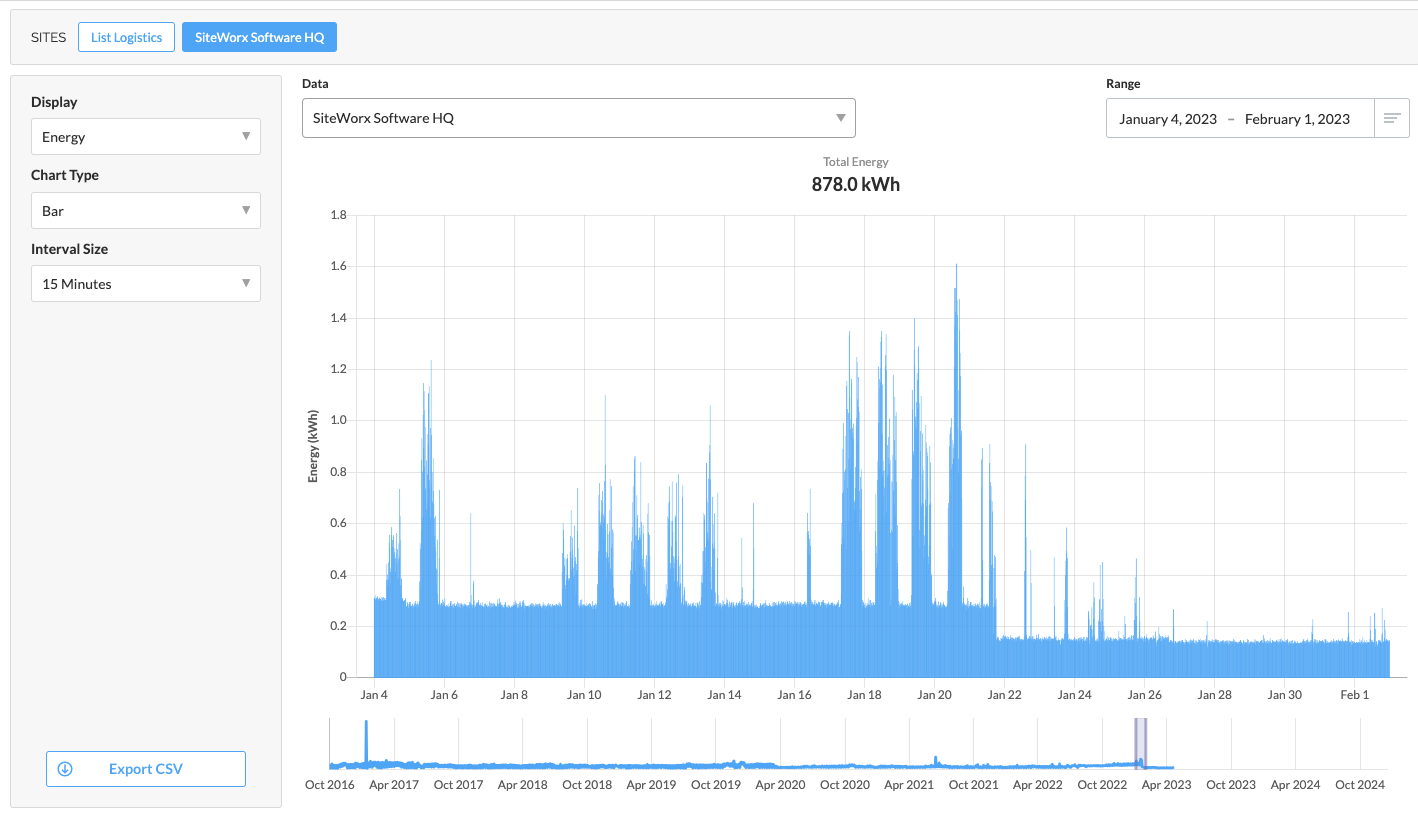
Interval Size
Use the Interval Size drop-down menu to select the data interval size: day, hour, or 15 minutes.

Interval size also dictates the granularity of exported data.
Selecting a shorter interval will provide more granular data such as the 15-minute interval below:
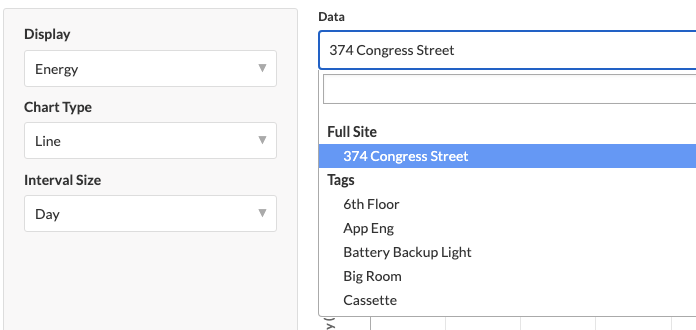
Data Drop-Down
Depending on the selected chart Display type, users may utilize the Data drop-down menu to specify which Tag or data source.
For example, by choosing an Energy Display type, the data drop-down will list all available Lighting Tags, Full Site, Power meters, and Smart Cord devices (if configured).
Alternatively, suppose any SiteWorx Sense related Display types are chosen, such as Temperature, Humidity, or Additional Sensors. In that case, a user may choose from a list of applicable sensors in the data drop-down menu.
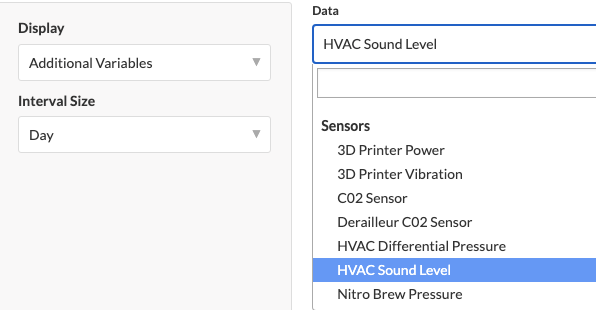
Finally, if a user selects one of the various power characteristics, a list of all available Power meters will be listed.
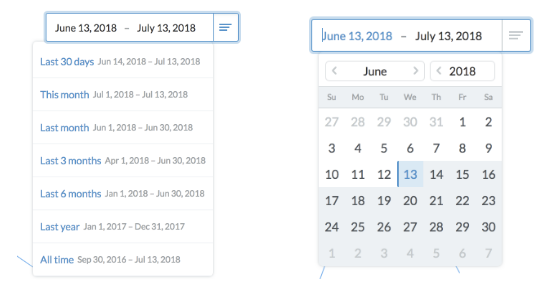
Data Range and Navigator
Use the Date Range drop-down to choose from one of the presets or enter a customer start and end date.
SiteWorx Analyze also contains a navigator feature, located below the main chart. Here you can click and drag across the timeline to hone in on an area of interest. Expanding and contracting the shaded area will automatically increase or reduce the date range, honing in on the data you’d like to display.
Export CSV
To download the displayed data, a user can click the Export CSV button in the Chart Options Panel. A CSV file will be downloaded, with data specific to the date range and interval size.
Additional Reporting Resources
Refer to further documentation for the following topics:
- System savings information can be found in the Savings Dashboard. Reference the Savings Overview.
- Run a Historical Sense Report
- Run Lighting Energy and Occupancy Reports
Related Articles
Energy and Occupancy Reports
For information on how Lighting data is calculated, visit the Analyze Overview page. A Tag is a user-defined collection of lighting fixtures/sensors, used for data reporting. For help with creating a Tag, visit Create a Tag. Only Admins can create ...Use Case: Data Reporting
Identify and report on energy-saving achievements SiteWorx Analyze helps customers examine and understand data and insights from their facilities. The easy-to-use data visualization tools lets customers interact with various types of data gathered ...Historical Sense Reporting
To run a historical report for a particular Sense Device datasource like temperature, relative humidity, or energy usage from a power meter, follow the steps below: Click the Analyze icon in the Application Navigation Menu Alternatively, hover over a ...Getting Started - Analyze
After setting up SiteWorx Area, get familiar with SiteWorx Analyze. Analyze is a reporting suite that helps decision-makers gain insight into the operations of their business. These insights help businesses increase productivity, maximize savings, ...Tags in SiteWorx
Overview of Tags A Tag is a user-defined collection of lighting fixtures/sensors used for data reporting. Tags allow users to quickly create granular reports on specific areas of a facility to hone in on trends. You can find the Tag Manager in the ...